
https://www.elastic.co/beats/auditbeat for Linux
Questions
- What is the earliest process (equivalent to the Window's first smss.exe) that this tool can capture?
- Is there similar commandline strings when launching a Linux process?
- What is "foreground" in the context of Linux endpoints? (eg. tty & even a GUI shell)
- How to ship events to OrientDB?
YJ's Documentation
Overview of Auditbeat
Auditbeat is an open-source shipping agent from Elastic that you can install on your servers to audit the activities of users and processes on your systems. Additionally, Auditbeat can be used to detect changes to critical files, like binaries and configuration files, and identify potential security policy violations.
References:
Setting up Elastic Stack
Before we can install and set-up Auditbeat, we first need to install Elasticsearch and Kibana. Elasticsearch is used for storing and searching the data while Kibana is used for visualizing and managing the data.
Flow: Auditbeat → Elasticsearch → Kibana
Installation of Elasticsearch
Elasticsearch is a real-time, distributed storage, search, and analytics engine.
To download and install Elasticsearch, refer to https://www.elastic.co/guide/en/elastic-stack-get-started/7.13/get-started-elastic-stack.html#install-elasticsearch and use the commands that work with your system.
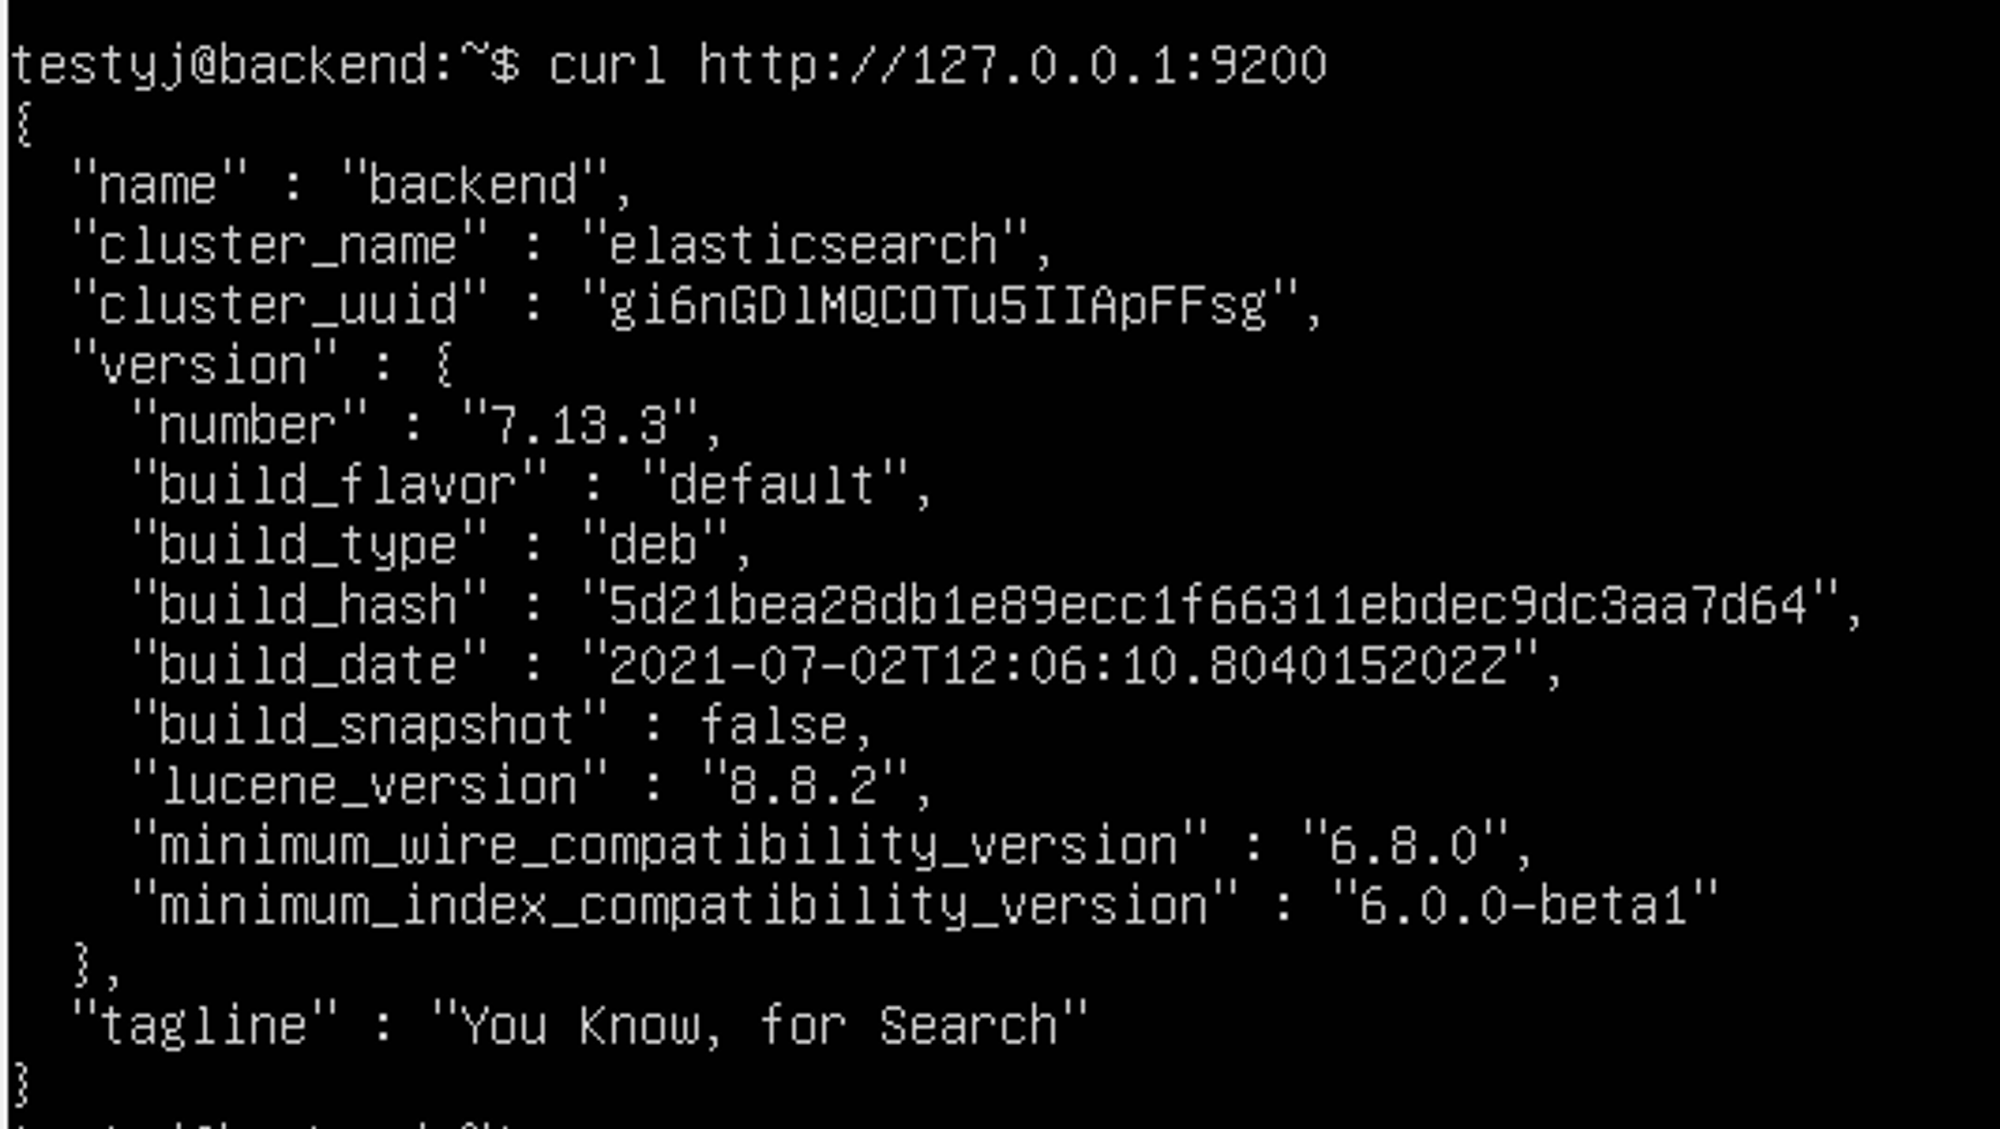
After installation of Elasticsearch, test that the Elasticsearch daemon is up and running by sending an HTTP GET request on port 9200.
curl http://127.0.0.1:9200You should see a response similar to this:
In order to access Elasticsearch remotely, you need to add these two lines in the yml file:
transport.host: localhost
network.host: <IP ADDRESS>
Reference:
Installation of Kibana
Kibana is an open source analytics and visualization platform designed to work with Elasticsearch. You use Kibana to search, view, and interact with data stored in Elasticsearch indices. You can easily perform advanced data analysis and visualize your data in a variety of charts, tables, and maps.
To download and install Kibana, refer to https://www.elastic.co/guide/en/elastic-stack-get-started/7.13/get-started-elastic-stack.html#install-kibana and use the commands that work with your system.
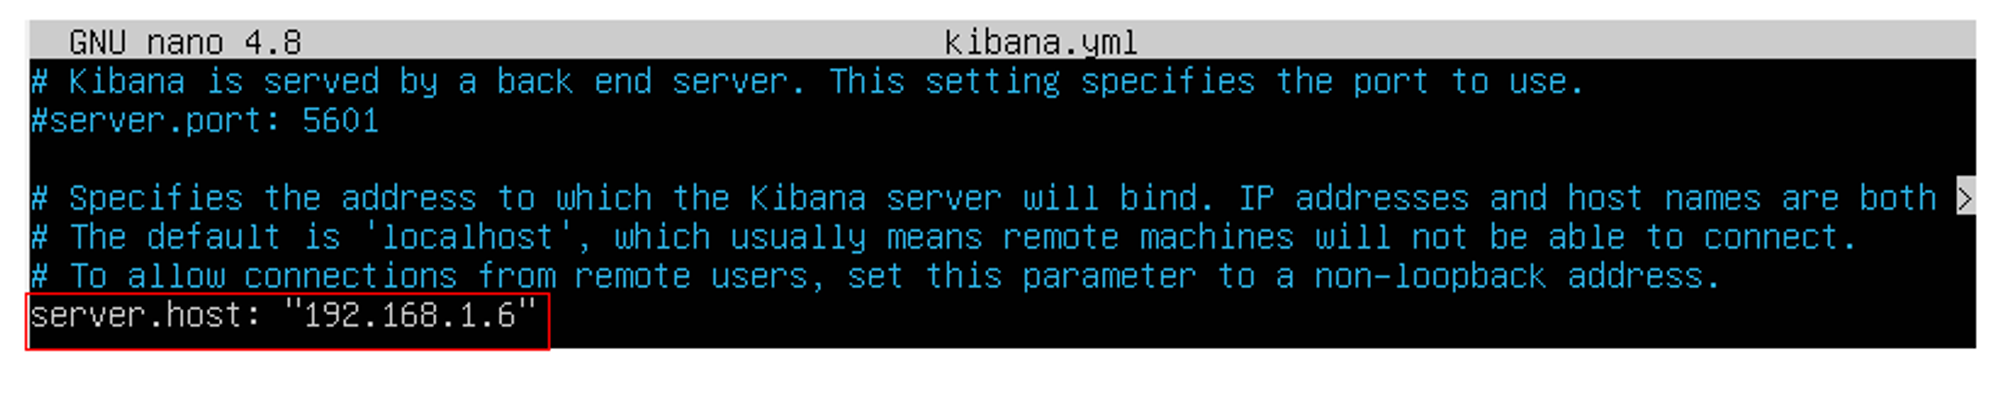
The default host and port settings configure Kibana to run on localhost:5601, meaning that remote machines will not be able to connect. To allow remote users to connect, you will need to update your kibana.yml file by setting the value of server.host to the IP address of the Kibana server:
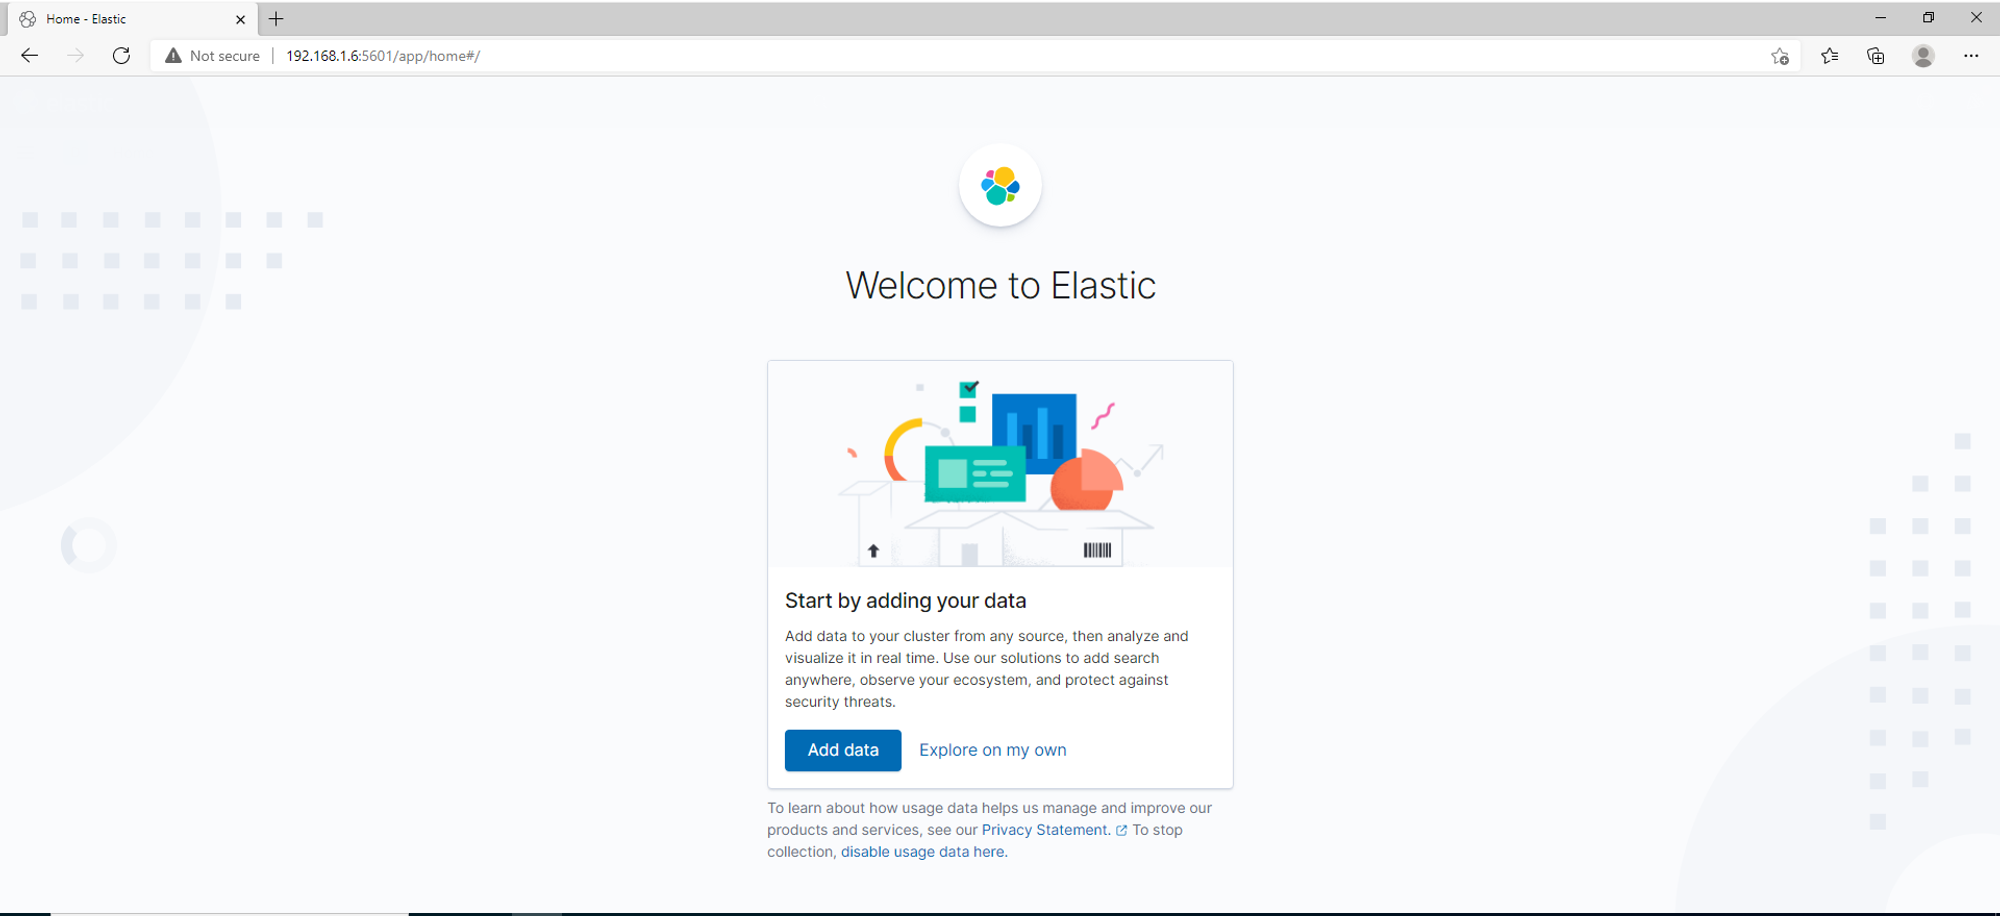
To test if Kibana is working, enter http://<IP ADDRESS>:5601 into your browser and you should be able to see Kibana web interface:
Installation of Auditbeat
After installing Elasticsearch and Kibana, the final step is to install and setup Auditbeat. Refer to https://www.elastic.co/guide/en/beats/auditbeat/current/auditbeat-installation-configuration.html and follow the steps provided.
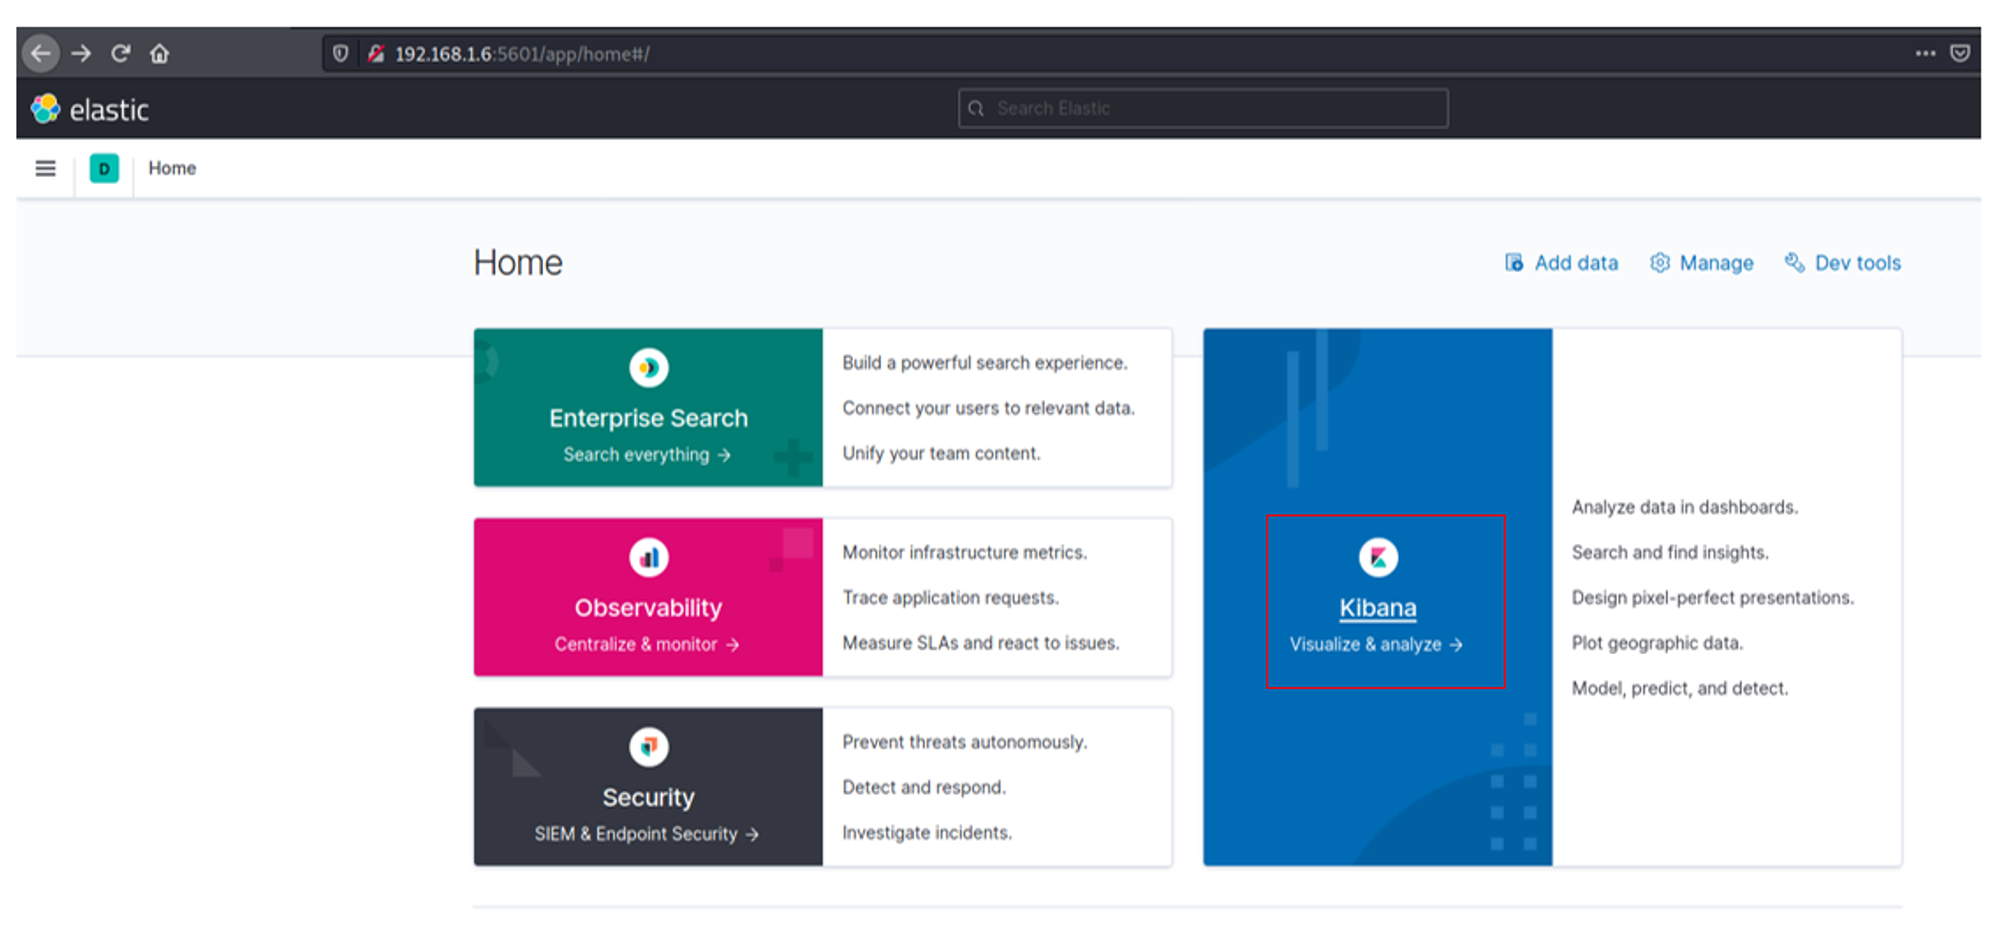
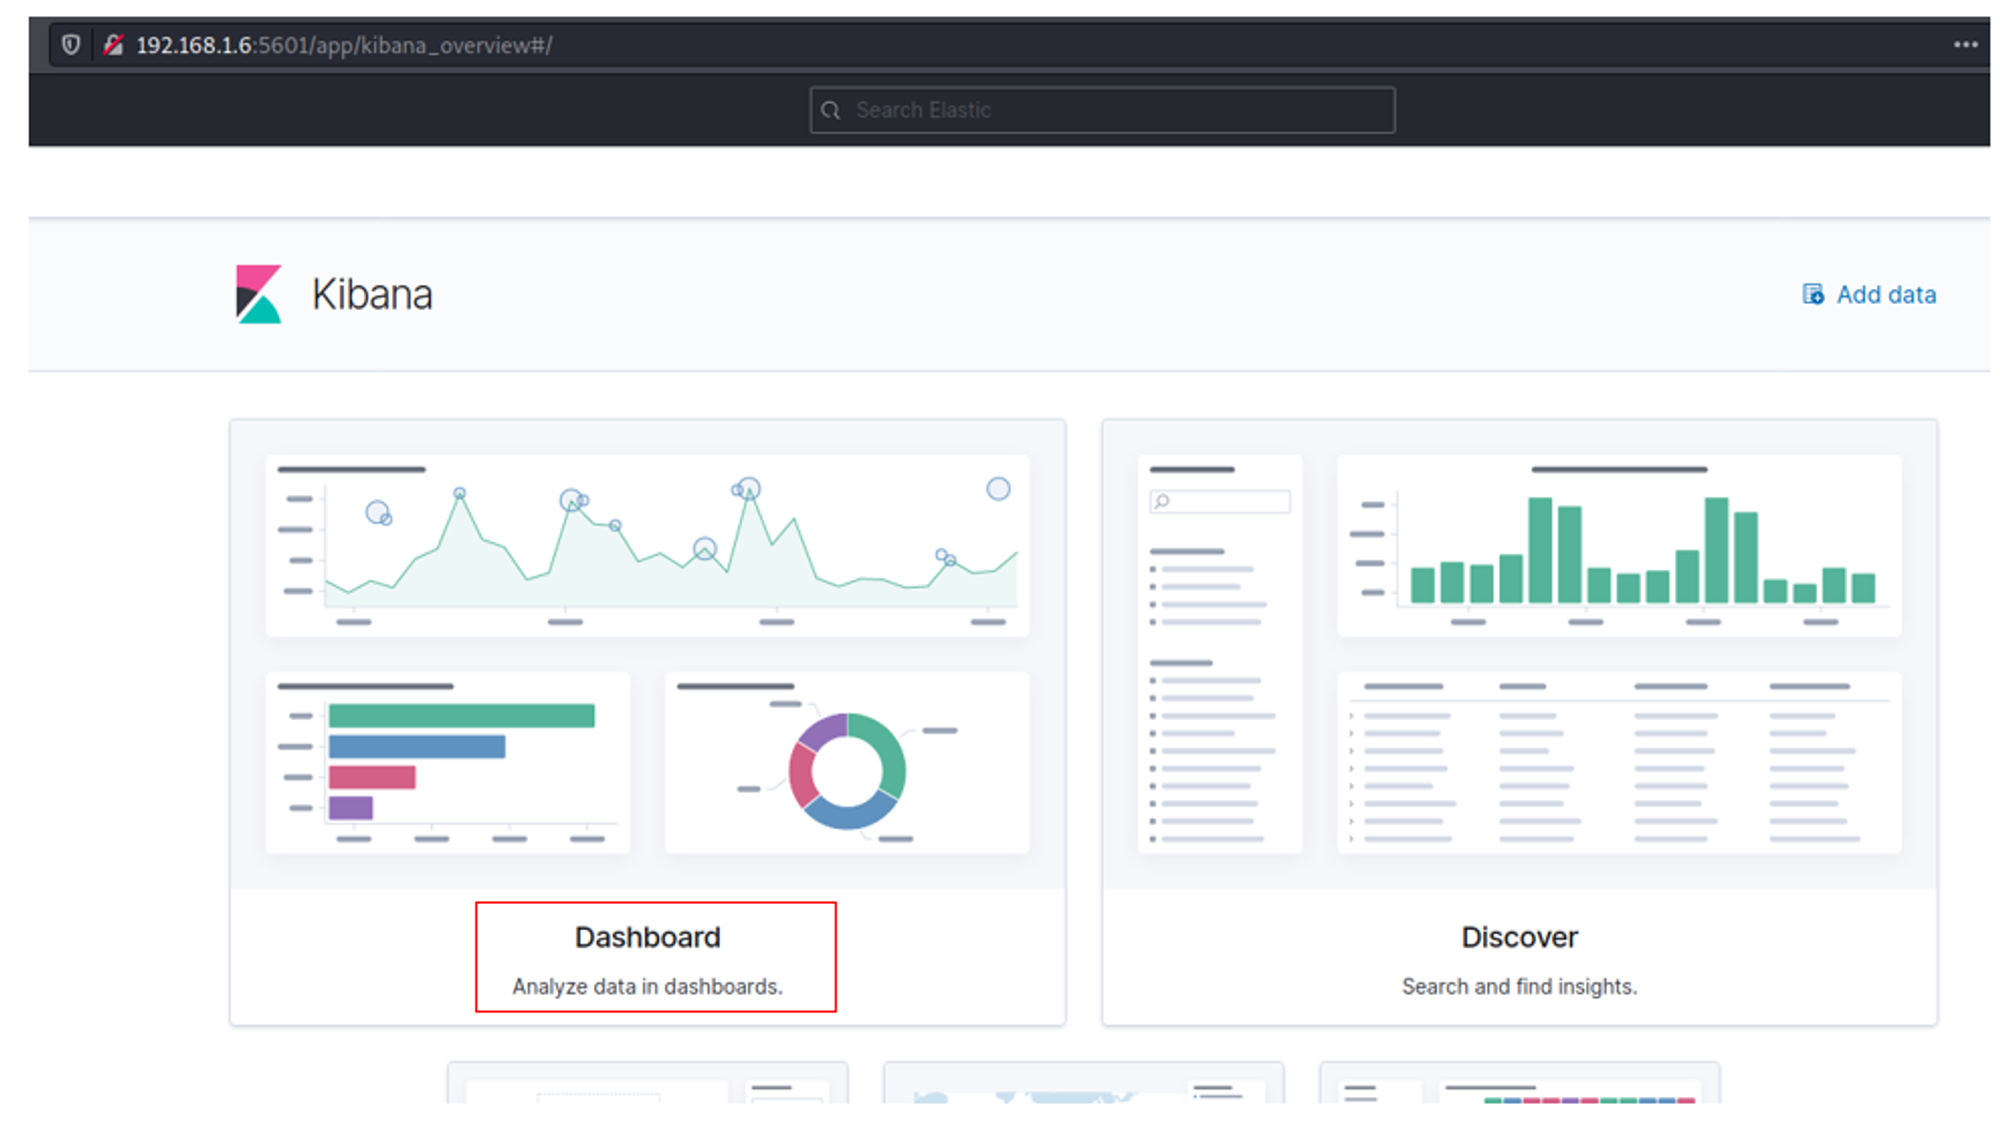
After installing Auditbeat, we can access the Auditbeat dashboard through Kibana web interface. On the home page, select Kibana option as shown in the red box below:
Next, select the Dashboard option.
There will be a list of sample dashboards for visualizing the log data in Kibana. Since we are interested in log data about processes, we will select the Process Dashboard ECS:
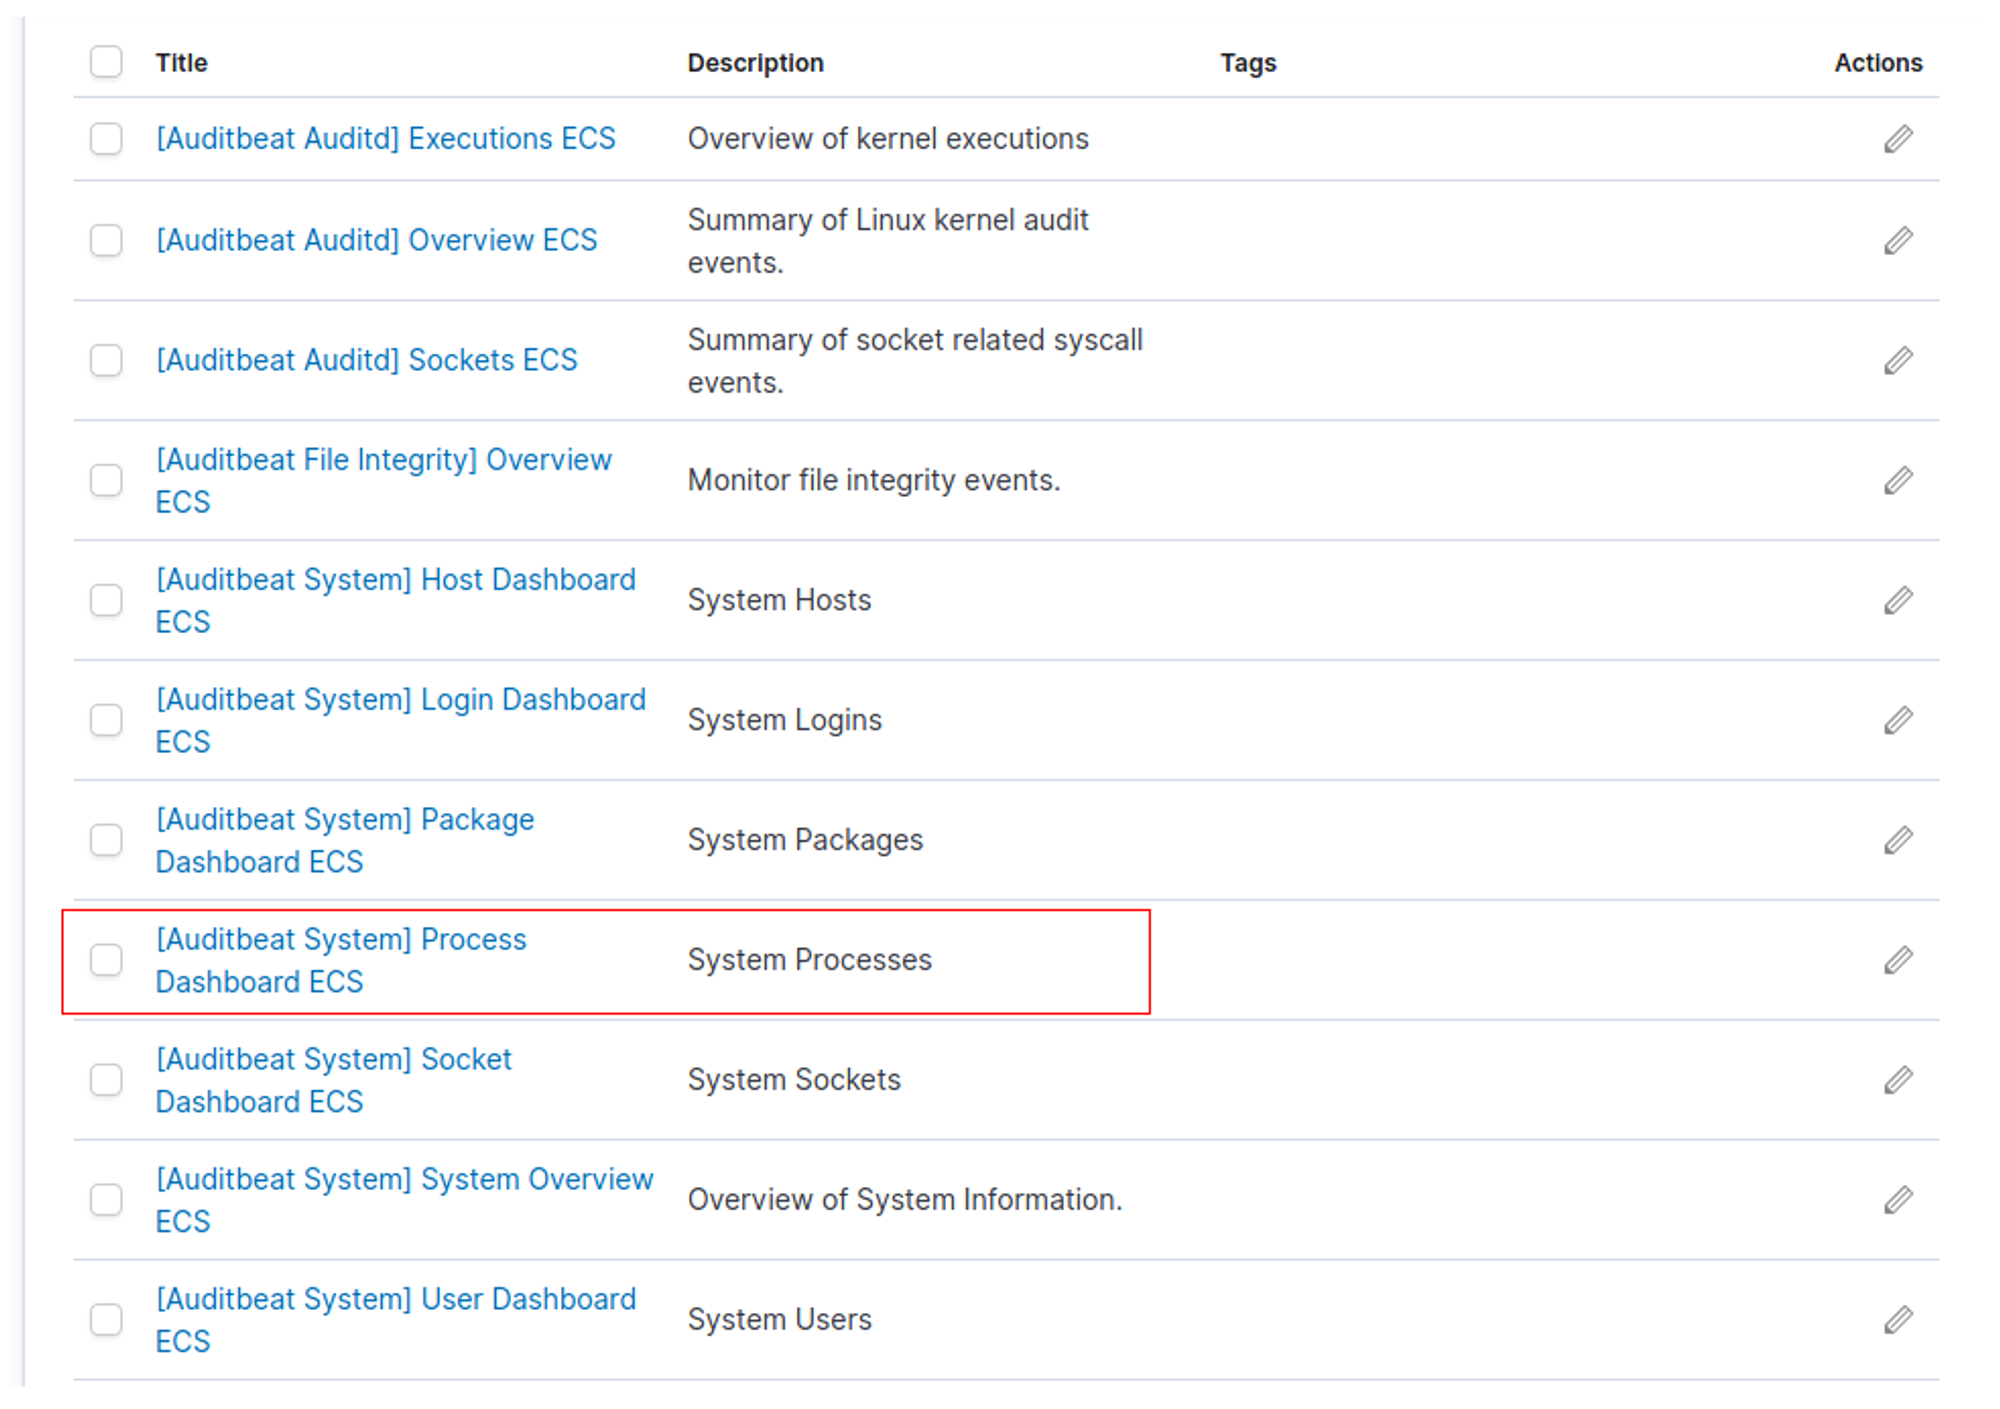
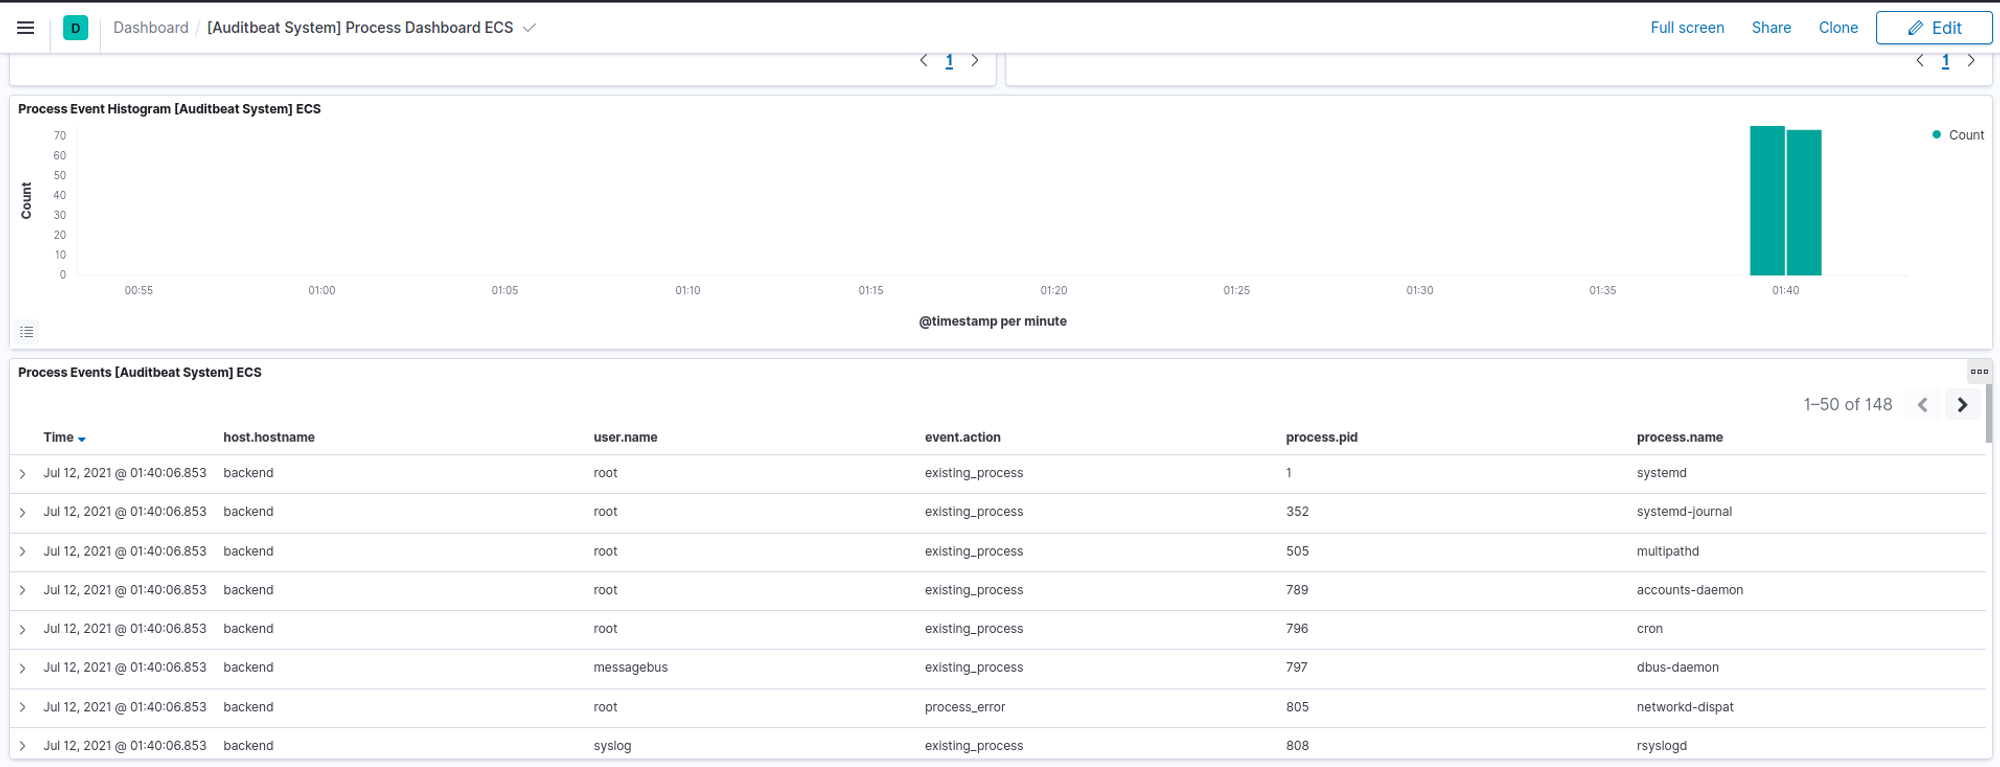
With Process Dashboard, we can view the process events logged by Auditbeat.
How does Auditbeat work?
Auditbeat communicates directly with the Linux audit framework, collects the same data as auditd, and sends the events to the Elastic Stack in real time. As seen in the configuration file auditbeat.yml, Auditbeat collects log data through the use of 3 modules:
- Auditd module
- File Integrity module
- System module
Auditd module
The auditd module receives audit events from the Linux Audit Framework that is a part of the Linux kernel. This module establishes a subscription to the kernel to receive the events as they occur.
More information about the Auditd module can be found here https://www.elastic.co/guide/en/beats/auditbeat/master/auditbeat-module-auditd.html
File Integrity module
The file_integrity module sends events when a file is changed (created, updated, or deleted) on disk. The events contain file metadata and hashes.
More information about the file_integrity module can be found here https://www.elastic.co/guide/en/beats/auditbeat/master/auditbeat-module-file_integrity.html
System module
The system module collects various security related information about a system. All datasets send both periodic state information (e.g. all currently running processes) and real-time changes (e.g. when a new process starts or stops). This module comes with a sample dashboard i.e. Process Dashboard that was shown earlier.
More information about the system module can be found here https://www.elastic.co/guide/en/beats/auditbeat/master/auditbeat-module-system.html
Answers to Questions
Question 1: What is the earliest process (equivalent to Window's smss.exe) that this tool can capture?
/usr/lib/systemd/systemd is the first/earliest process that gets captured by Auditbeat.
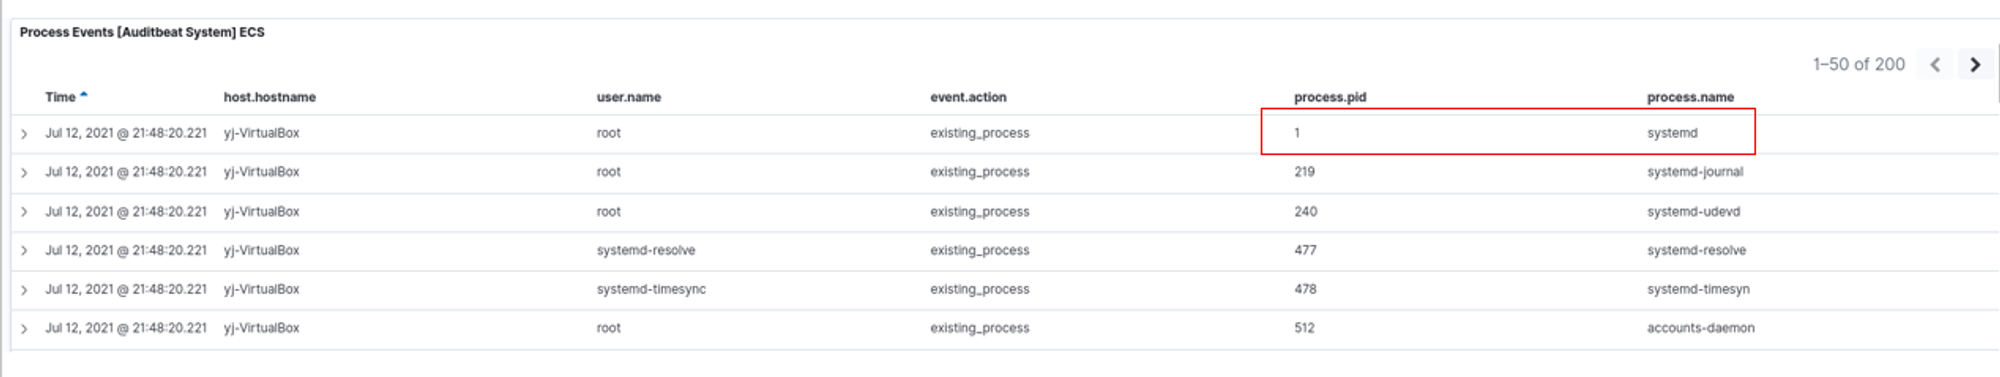
systemd is a system and service manager for Linux OS. According to https://www.tecmint.com/systemd-replaces-init-in-linux/, systemd is the parent of all other processes directly or indirectly and is the first process that starts on boot. Hence, it is typically assigned as PID 1, which is reflected in the screenshot above.
Answer: systemd
Other references:
Question 2: Are there similar CommandLine strings when launching a Linux process?
In Auditbeat, there is a field called auditd.data.cmd that tells you the command that was executed.
After I entered the command
sudo nano test.txt on my Ubuntu machine, Auditbeat was able to capture the command used as shown in the screenshot below:
However after further testing, only commands used with sudo will be captured into auditd.data.cmd, meaning that
nano test.txt is not captured.After further exploration, I found a field called process.title which tells you the exact command that was executed.
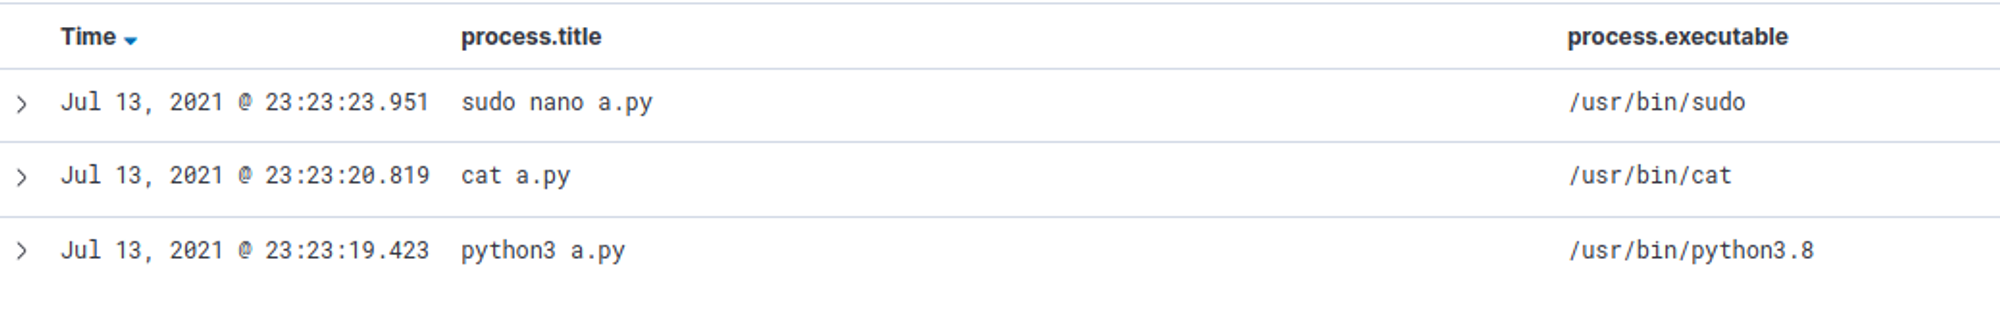
Another useful field to note is process.executable, which records the path to the executable that was used to run the process (same as Sysmon's Image field).
Answer: process.title field tells you the command line string that was executed.
Question 3: What is "foreground" in the context of Linux endpoints? (eg. tty & even a GUI shell)
A foreground process is one that occupies your terminal e.g. tty/pts, meaning that any new commands that are typed have no effect until the previous command is finished.
To determine whether a process is foreground or background, we can use the auditd.data.tty field. The auditd.data.tty field records the terminal from which the user is running programs on.
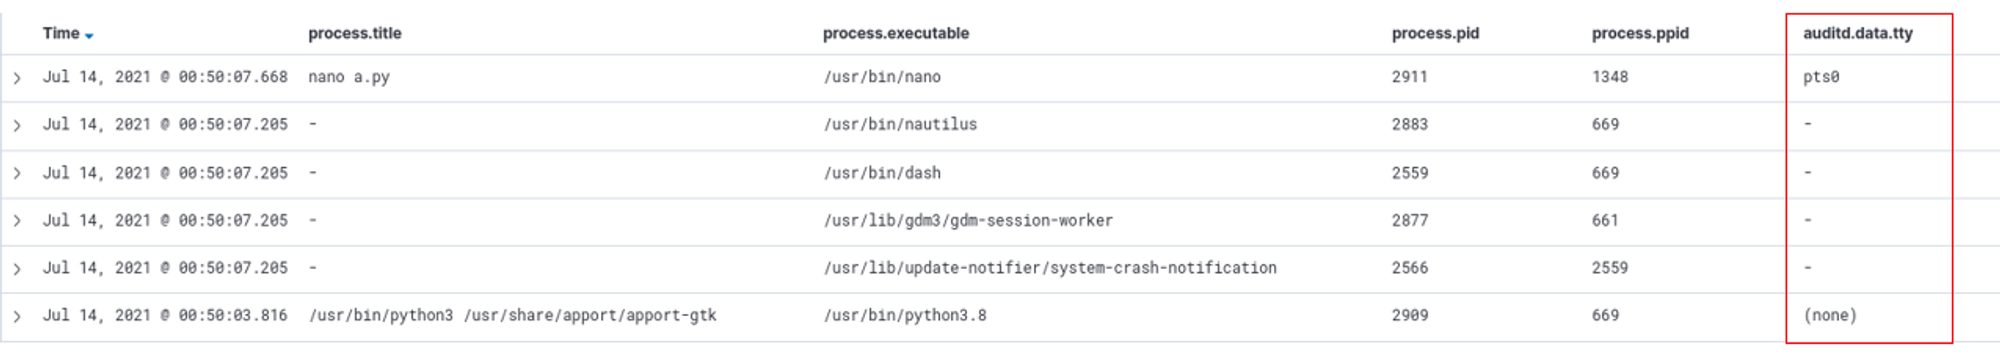
For background processes, auditd.data.tty = (none).
For foreground processes, auditd.data.tty = pts.
If auditd.data.tty = -, it means that the process is neither foreground nor background e.g. daemons.
Answer: A process is foreground if auditd.data.tty = pts.
Question 4: How to build process lineage sequence?
To build process lineage sequence, we can make use of two fields i.e. process.pid & process.ppid. The pid field records the Process ID (PID) while the ppid field records the Parent Process ID (PPID). In this example, we see that the PPID of these /usr/bin/sudo is 1348.

This is the result when I queried in Kibana "process.pid: 1348":

From the query, we can see that /usr/bin/bash is the parent process of /usr/bin/sudo. Repeat these steps and eventually we will find a process with "process.ppid = -" i.e. NIL.
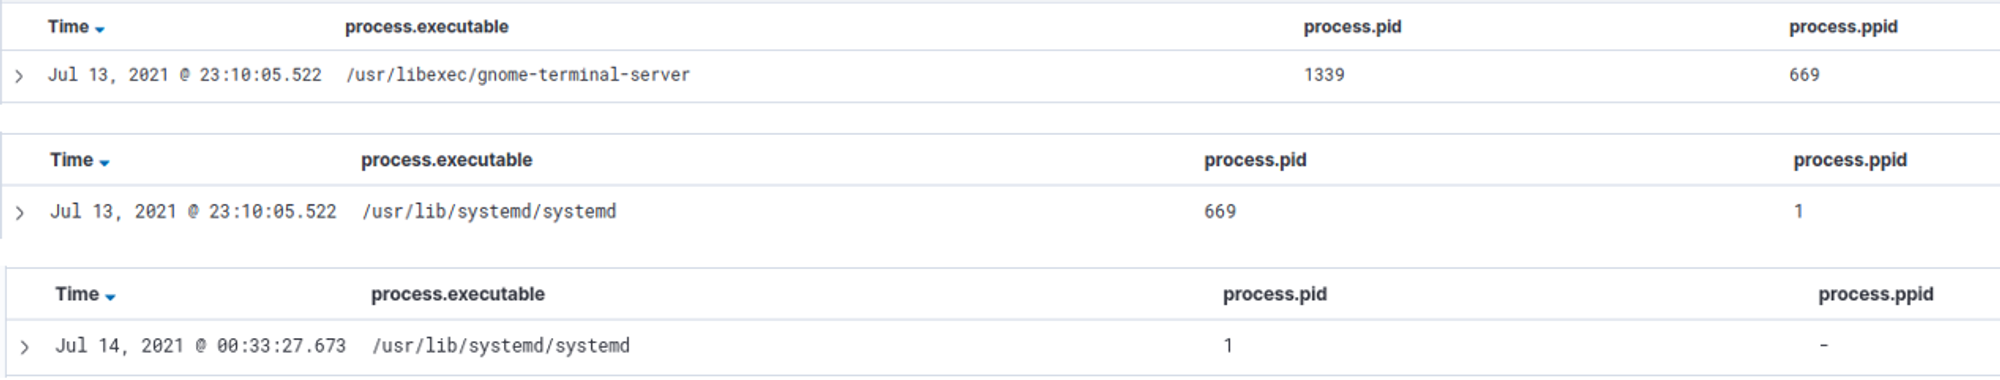
The process with "process.ppid = -" means that it is the root parent process. From here, we can come up with the process lineage sequence:
systemd → systemd → gnome-terminal-server → bash → sudo → ...
Answer: Use process.pid & process.ppid to build process lineage sequence.
Reference:
Question 5: How to ship events to OrientDB?
According to https://www.elastic.co/guide/en/beats/auditbeat/current/configuring-output.html, these are the supported outputs for Auditbeat:
- Elasticsearch
- Elastisearch
- Logstash
- Kafka
- Redis
- File
- Console
It seems that the only way to ship events from Auditbeat to OrientDB would be through the use of Logstash i.e. Auditbeat → Logstash → OrientDB.
Hence, I went to look into the list of supported output for Logstash. You can find the full list of supported output plugins for Logstash in this link https://www.elastic.co/guide/en/logstash/current/output-plugins.html. Looking through the list, I was unable to find a output plugin to OrientDB. While searching, I found this https://github.com/purbon/logstash-output-orientdb which looks to be a community-made plugin to output data from Logstash to OrientDB. Issue is that this plugin was last edited 5-6 years ago, meaning that it is no longer maintained and might not work on newer versions of Logstash/OrientDB.