There should be only one...
Apart from Upload.exe, which other process will communicate to OpenEDR SFTP port 2222?
To find out which process is communicating on which port, we can use the Resource Monitor tool in Windows.
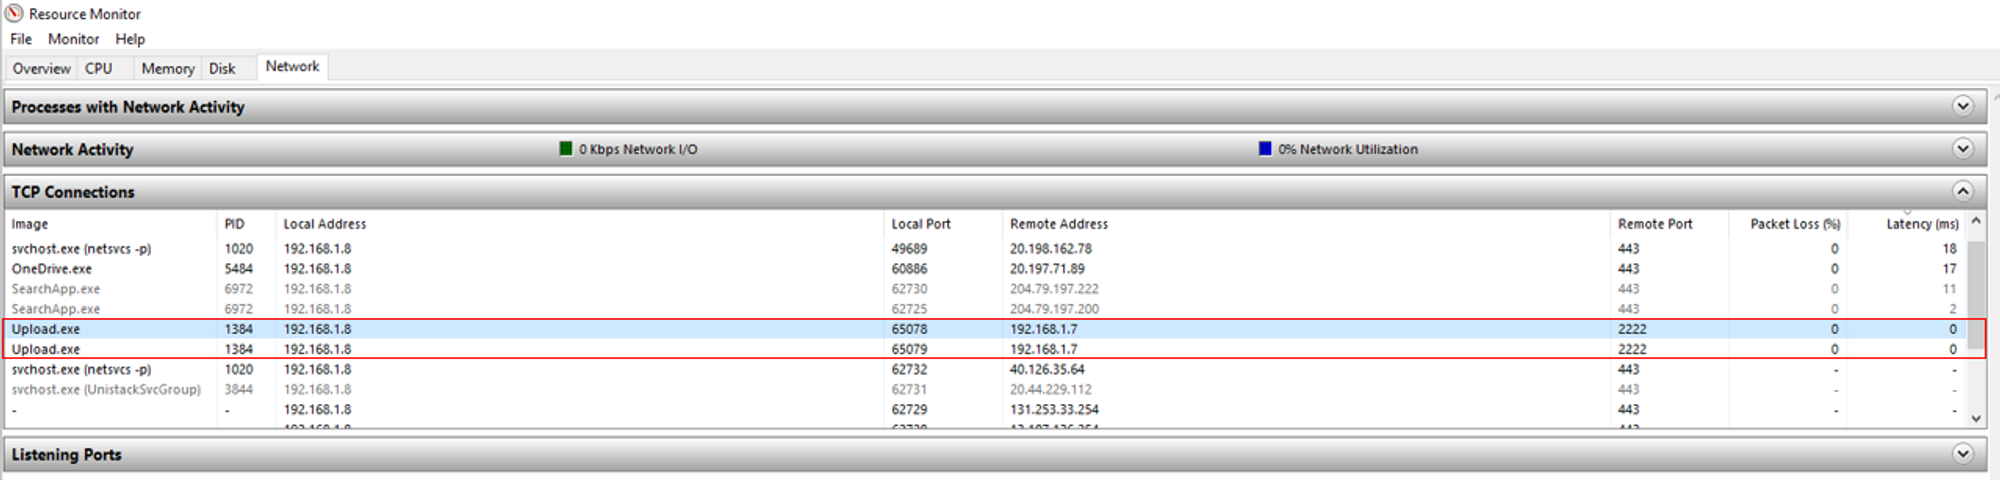
As shown from the screenshot above, only Upload.exe was communicating on port 2222, which is the SFTP service port to receive endpoint events.
When another process is connecting 2222, what does it imply?
This means that the process is attempting to connect to the backend SFTP server. This could imply that an adversary is trying to connect to the SFTP server from the compromised endpoint to transfer malicious files to infect the OpenEDR backend server.
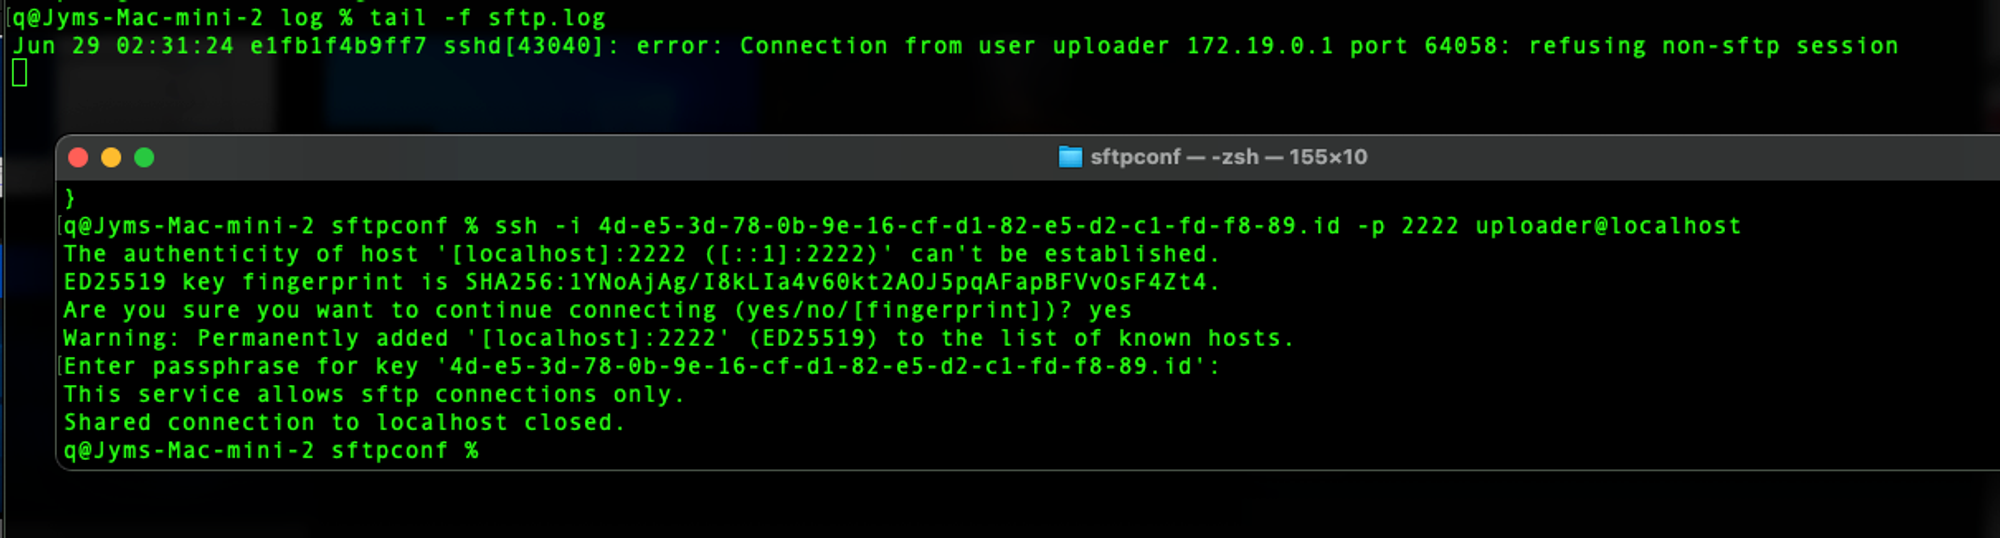
To prevent the occurrence of successful intrusions, the SFTP server has been configured to use a key-based authentication method in order to establish a connection. Without the id file, an adversary will not be able to connect to the SFTP server.
Using key-based authentication method is also much more secured as compared to using password-based authentication because passwords are more prone to brute-force attacks. Even if the adversary was able to transfer the malicious file, he/she will not be able to access/execute the file because the SFTP is configured to be "one-way" i.e. you can only write to it. Aside from Sysmon capturing NetworkConnect events, the SFTP container will capture SSH attempts into the SFTP server, which will be unsuccessful because the SFTP server has been configured to deny SSH access.
References:
Quick Test: Capturing Port 2222 NetworkConnect events
Initial attempt to query for NetworkConnect events generated by Upload.exe:
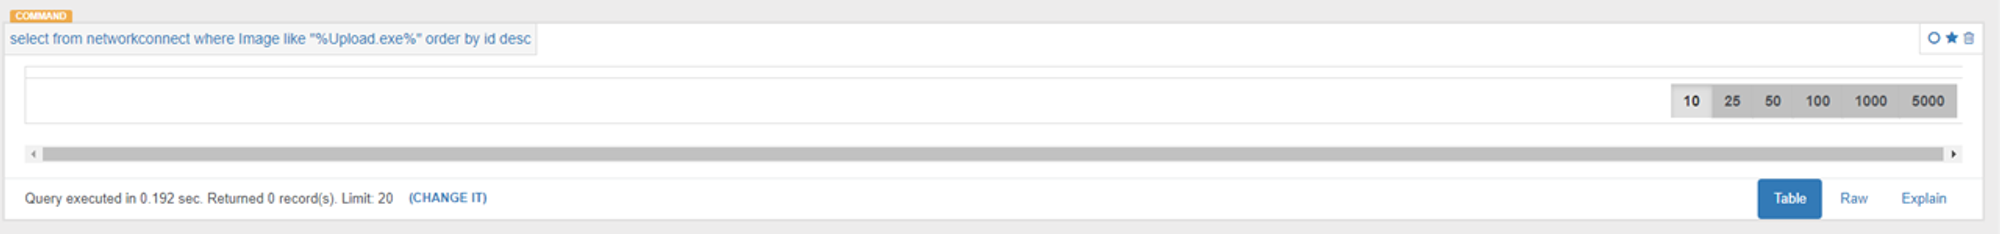
NetworkConnect Missing!
As shown in the screenshot above, Sysmon did not capture any NetworkConnect events generated by Upload.exe even though the process is communicating on port 2222. To figure out why this was happening, I went to look into Sysmon's configuration file.
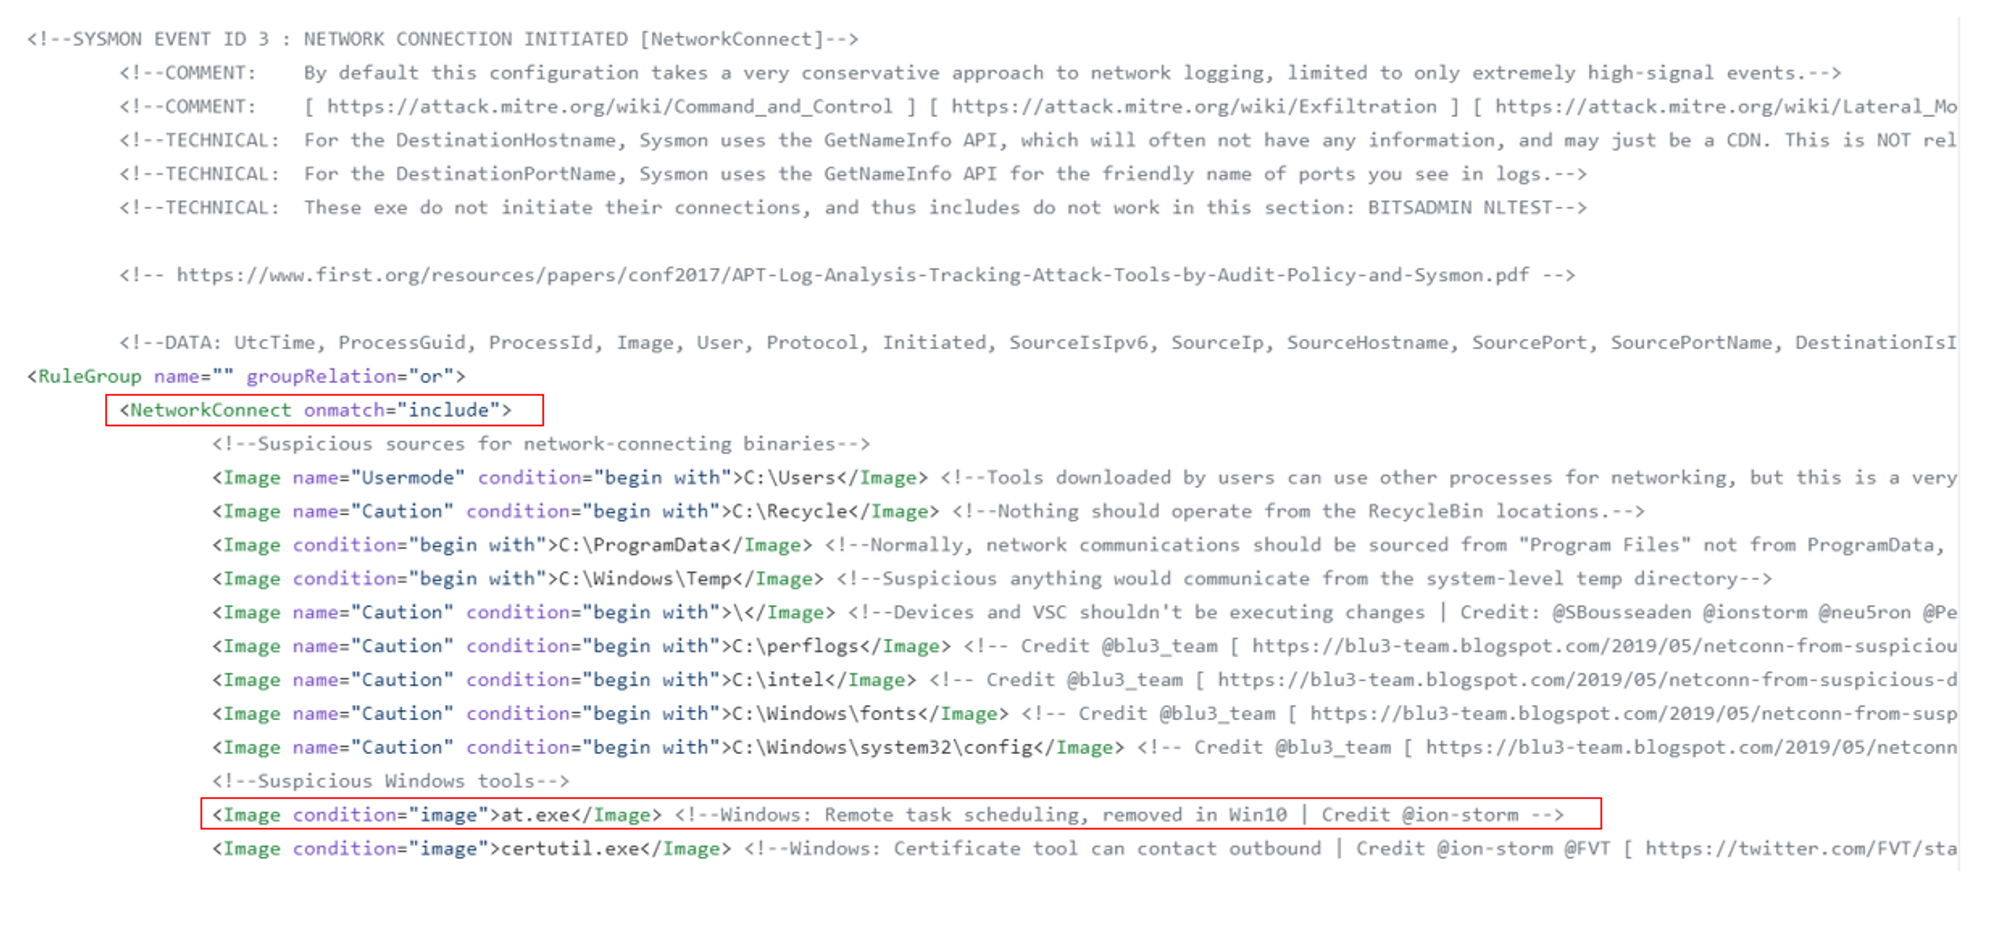
As shown in the screenshot above, the first red box indicates that the onmatch include filter has been added to NetworkConnect.
Filters are added to Sysmon so that only specific processes are captured while the rest are dropped. The rationale behind filtering is to drop noisy processes that would flood Sysmon and ODB with lots of meaningless events. This will lead to resource overloading and eventually cause the backend to go down.
Filtered Out by OnMatch = 'include' Conditions
The onmatch include filter means that Sysmon will only capture NetworkConnect events that fulfills at least one of the specified conditions. For example, the second red box in the screenshot indicates that Sysmon will capture NetworkConnect events from at.exe. Since Upload.exe was not specified in the include conditions, Sysmon will not capture NetworkConnect events generated by Upload.exe.
To start capturing NetworkConnect events from port 2222, perform the following steps:
- Download the XML file into a txt file and remove the entire INCLUDE block for NetworkConnect
- Open admin cmd and enter the command: sysmon -c smconfig.txt (or whatever filename you saved it to)
Sysmon will now start capturing NetworkConnect events to port 2222.
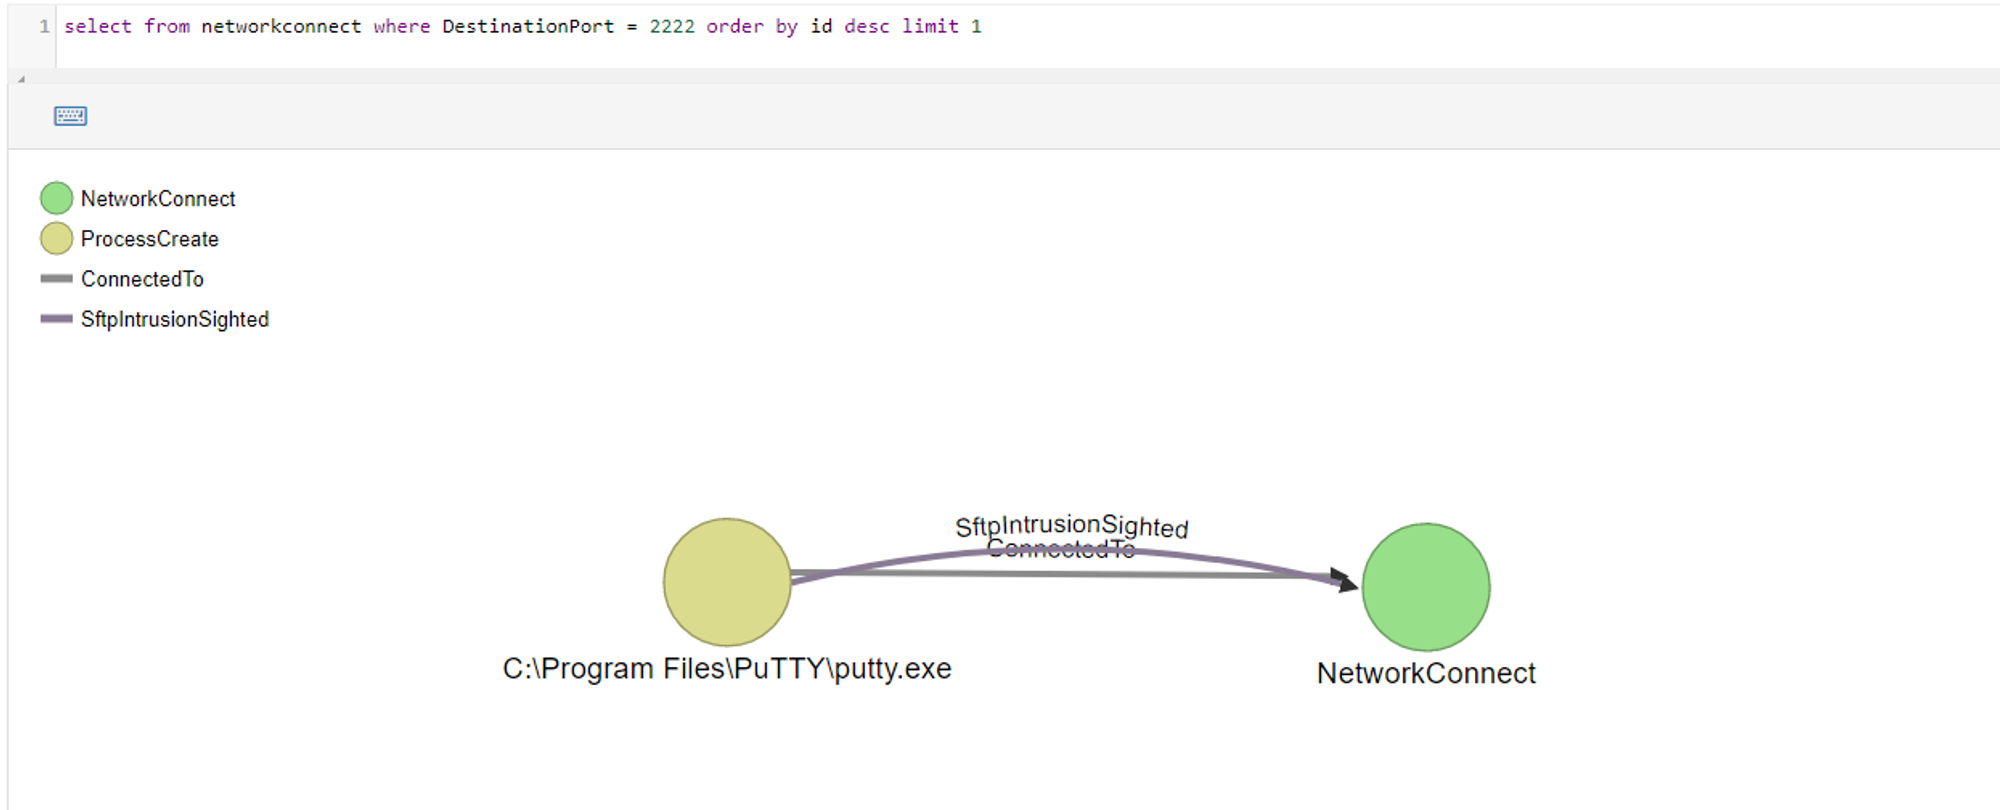
To test that it is working, use Putty and connect to backend using port 2222. While the SSH client holds the connection for the login prompt, query in ODB for NetworkConnect events where DestinationPort = 2222.
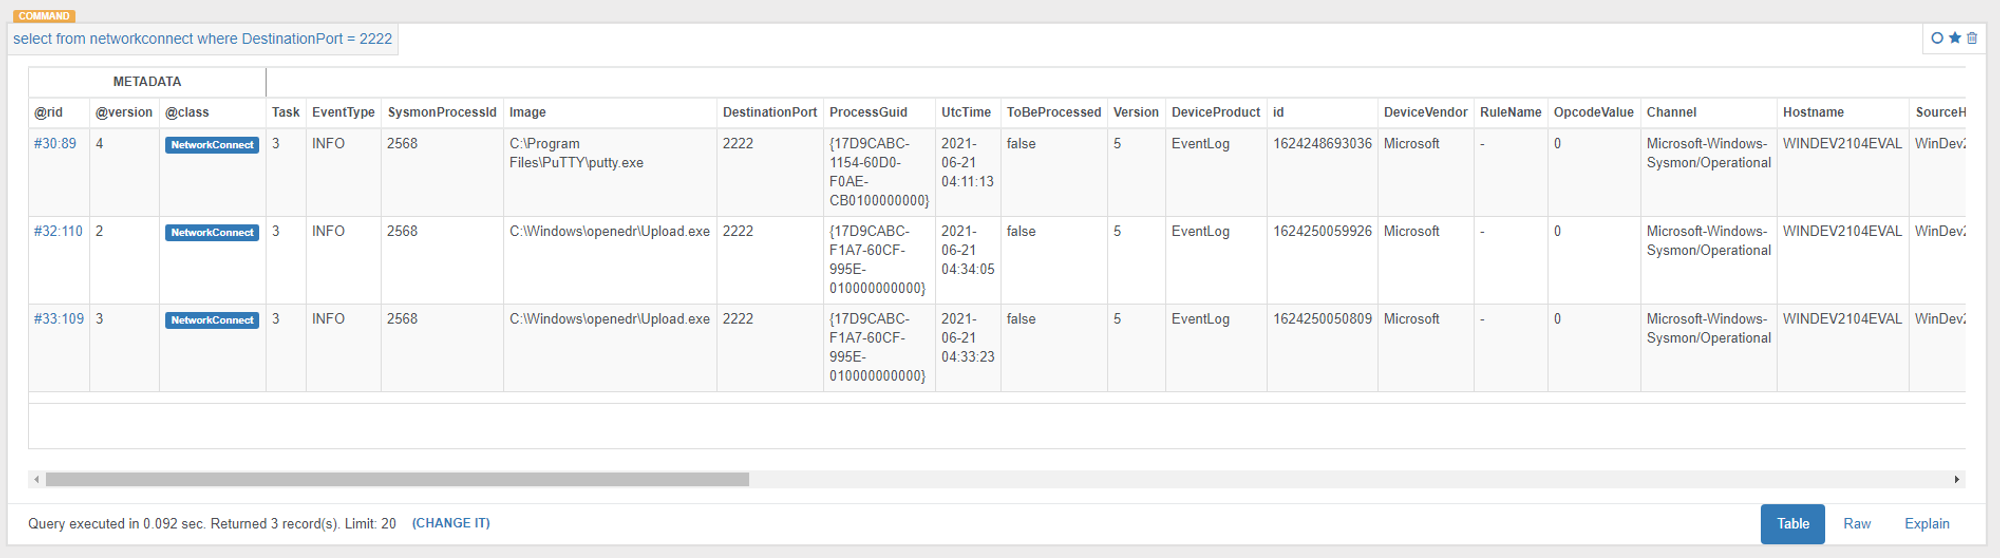
As shown in the screenshot above, Sysmon was able to capture putty.exe and Upload.exe communicating on port 2222. The next step will be to design an alert when such events occur.
Design Phase
Flow Overview
NetworkConnect event ingested → OrientDB function creates alerting edge when conditions are met → startDetection.js receives alert & creates or updates Case → frontend.js deals with the Wekan frontend elements accordingly
Purpose of alert
As discussed earlier with Jym, the only process that communicates to port 2222 is Upload.exe. In the event that a process other than Upload.exe tries to connect to port 2222, it can be considered as suspicious behavior it is considered a reliable attack indicator especially if the process is a background process. Hence, there is a need to design an alert to notify analysts when such cases occur. Upon receiving the alert, analysts will need to investigate the process that triggered the alert and determine if it is benign or malicious.
How will the analysts see the alert?
There are two ways to display the alert:
- Through ODB console
- Through Wekan (Front-end investigation board)
Through ODB console
The first way to show the alert is via ODB console line. This can be done by modifying the NetworkConnect function to detect and trigger an alert when a process other than Upload.exe initiates a network connection on port 2222.
Example of alert message:

Pros:
- Fast & easy implementation
Cons:
- Requires an analyst to monitor the ODB console line in real-time
- Can be easy to miss out if there are many events coming in
Conclusion:
Displaying the alert via ODB console is not an effective method as it requires real-time monitoring of ODB console line. The alert messages can be easy to miss out when you have many events coming in from multiple endpoints. In all, this is not a feasible method to implement in an operational setting.
Through Wekan
The second way to show the alert is via the front-end investigation board, also known as Wekan (a web-based Kanban). This can be done by modifying startDetection.js to create a Triage case card when a process other than Upload.exe initiates a network connection on port 2222.
Pros:
- GUI alert
- Created case card will remain on the Triage board until it gets closed
Cons:
- Harder/longer to implement
Conclusion:
Displaying the alert via Wekan is a more effective approach as compared to displaying via ODB console line. Unlike the alert in ODB console line, the created case card in Wekan will remain on the Triage board until it gets closed by the analyst. It is also more feasible that the analyst monitors the Wekan in real-time as compared to monitoring the ODB console line in real-time. Hence, it would be best that the alert is displayed via Wekan in an operational setting.
Implementation Phase
Modification of NetworkConnect function
Now that Sysmon is able to capture processes communicating to port 2222, the next step will be to modify the NetworkConnect ODB server function to detect and alert when such events occur.
To do so, the following steps needs to be added:
- When processing NetworkConnect event, check for 3 conditions:
- DestinationPort = 2222
- DestinationIP = IP of your backend server
- Image ≠ C:\Windows\openedr\Upload.exe
- If all 3 conditions are met, print an alert message on the ODB console Example:
ALERT
Image has initiated a network connection to backend server on port 2222
Code:
if(r.field('DestinationPort') == 2222 && r.field('DestinationIp') == "192.168.1.7" && r.field('Image') != "C:\Windows\openedr\Upload.exe")
{
  print("ALERT!")
  print(r.field('Image') + " has initiated a network connection to backend server on port 2222")
}
Modification of startDetection.js
Overview of startDetection.js
startDetection.js is a script that is executed when Detection mode is enabled. Detection mode is enabled when you drag the Organisation card from the Profiling column to the Detection column.
Once enabled, the script will start live query which calls the eventHandler function, which handles all new events. When a new event comes in, the function will check for specific edges that are connected to the event e.g. CommandLineSighted. Note that all these edges are child classes of SightedTracking parent-class. The screenshot of OrientDB server-side function below shows the list of edges that it looks out for:
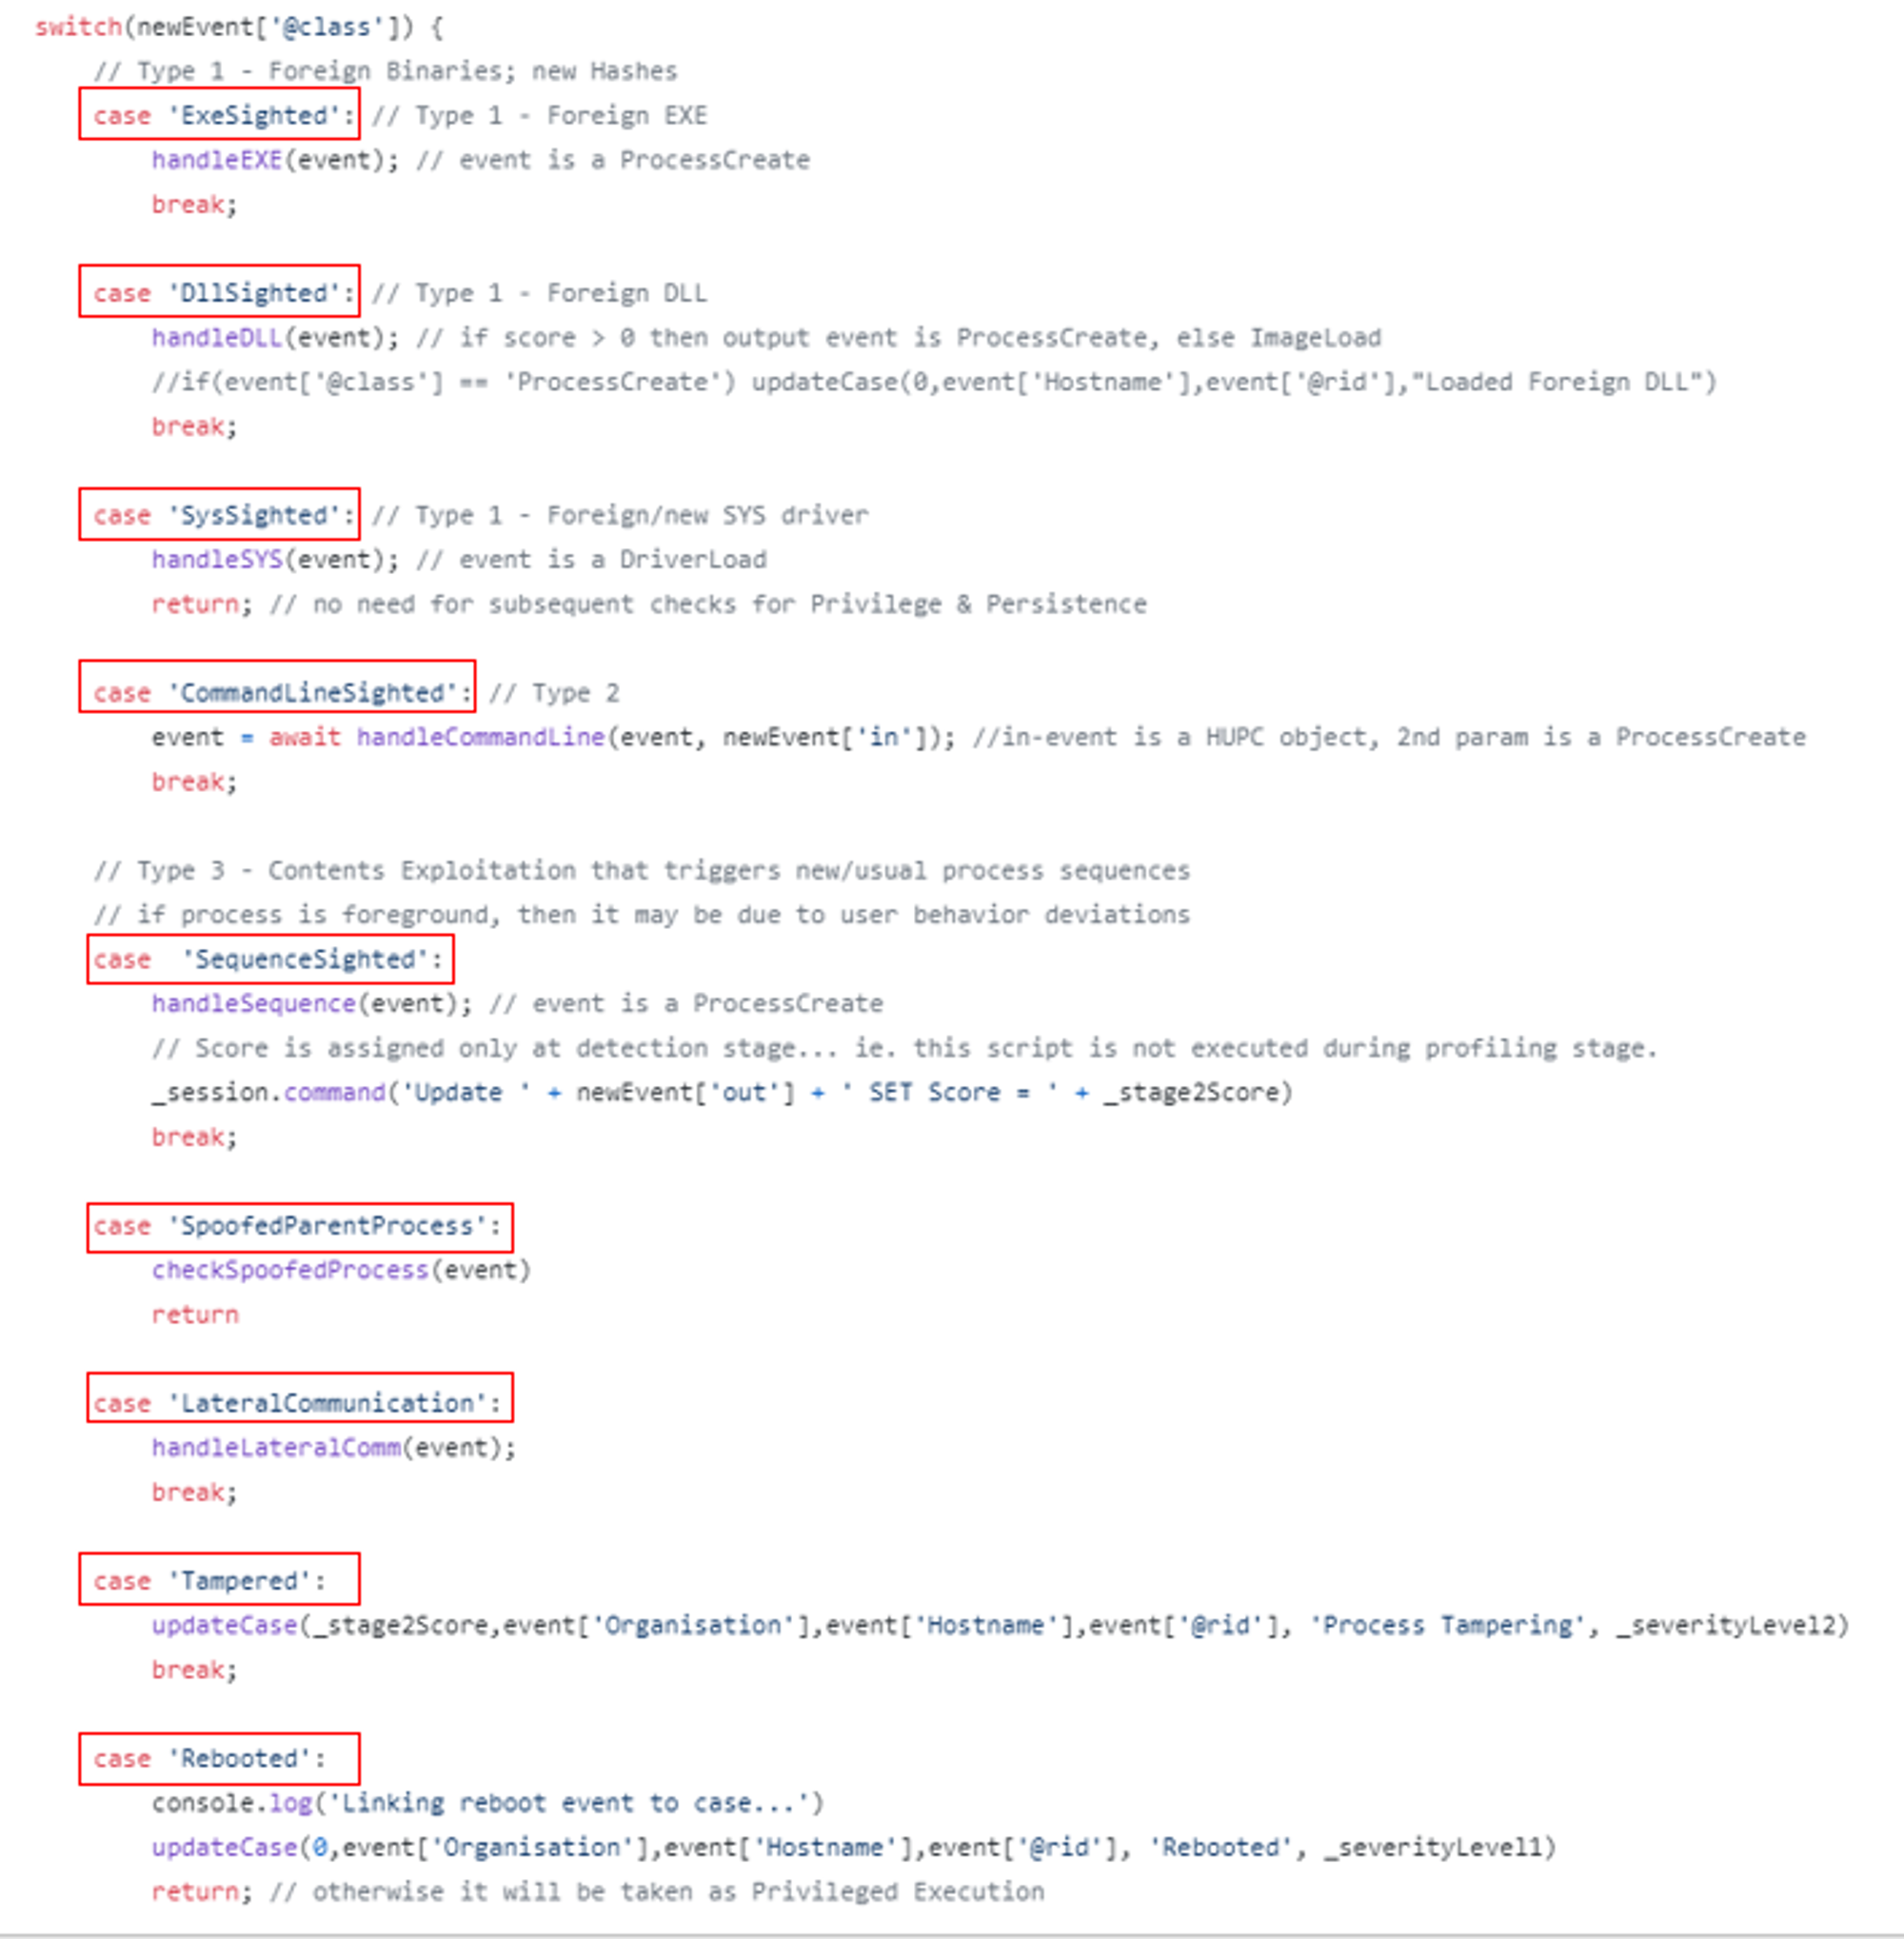
For each case, there is a specific function to handle and process it. The function will create or update a case card with scores based on different severity levels assigned to the edge-type (eg. Sys driver sighted is more severe than EXE Sighted in general, thus higher score). The severity level is assigned based on how severe/serious the case might be.
Each edge-type is related to an offensive tactics related to the Attack Life Cycle model. One example would be the LateralCommunication edge, which could indicate that an adversary is moving through the network in search of data or assets to exfiltrate. Hence, LateralCommunication cases are assigned a severity level of 3 as compared to Rebooted cases (usually benign) which is set to 1.
For every new ProcessCreate events, the script will call the following functions as shown in the screenshot below:
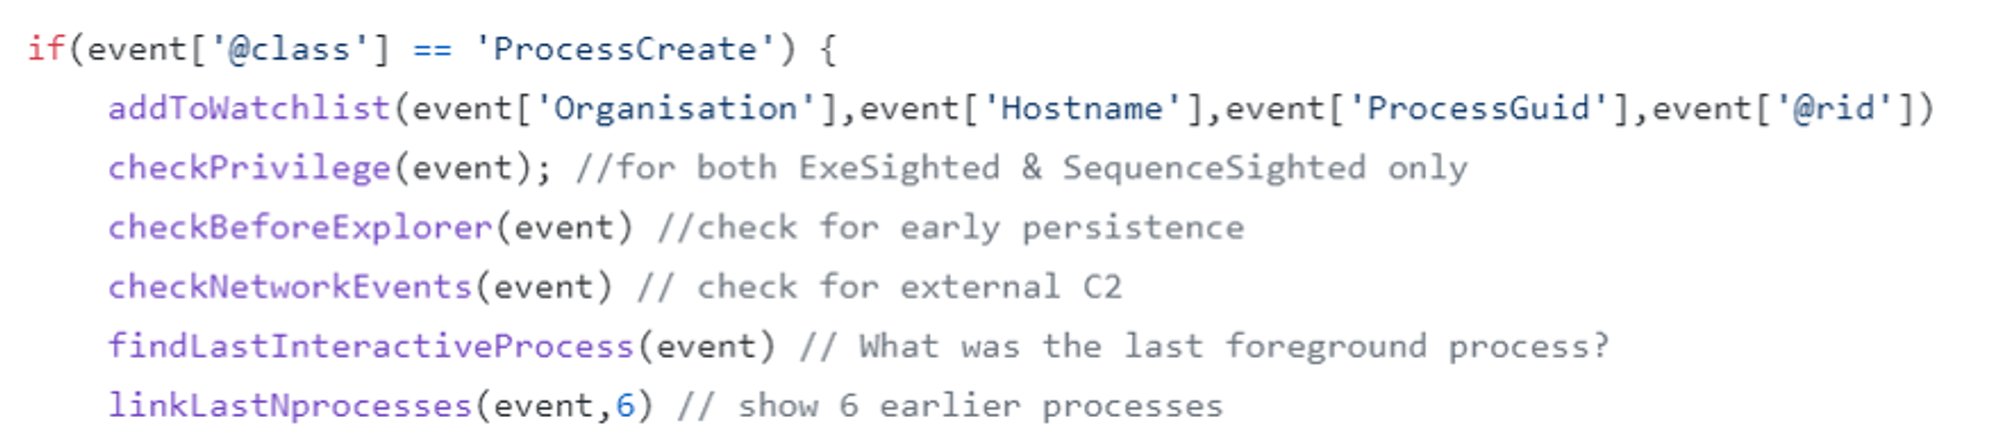
Summary of various related functions:
- checkPrivilege: Create (or update) a case if ProcessCreate event was executed in High/System privileges
- checkBeforeExplorer: Create a case if ProcessCreate event was executed before explorer.exe
- checkNetworkEvents: Create a case if ProcessCreate event initiated a network connection to someone outside of the network i.e. external network communication
- findLastInteractiveProcess: Find last foreground process
- linkLastNprocesses: Find 6 earlier processes
As long as detection mode is enabled, the script will constantly live query for events and create case cards according to the matched edges/conditions.
Reference:
Steps to implement alert
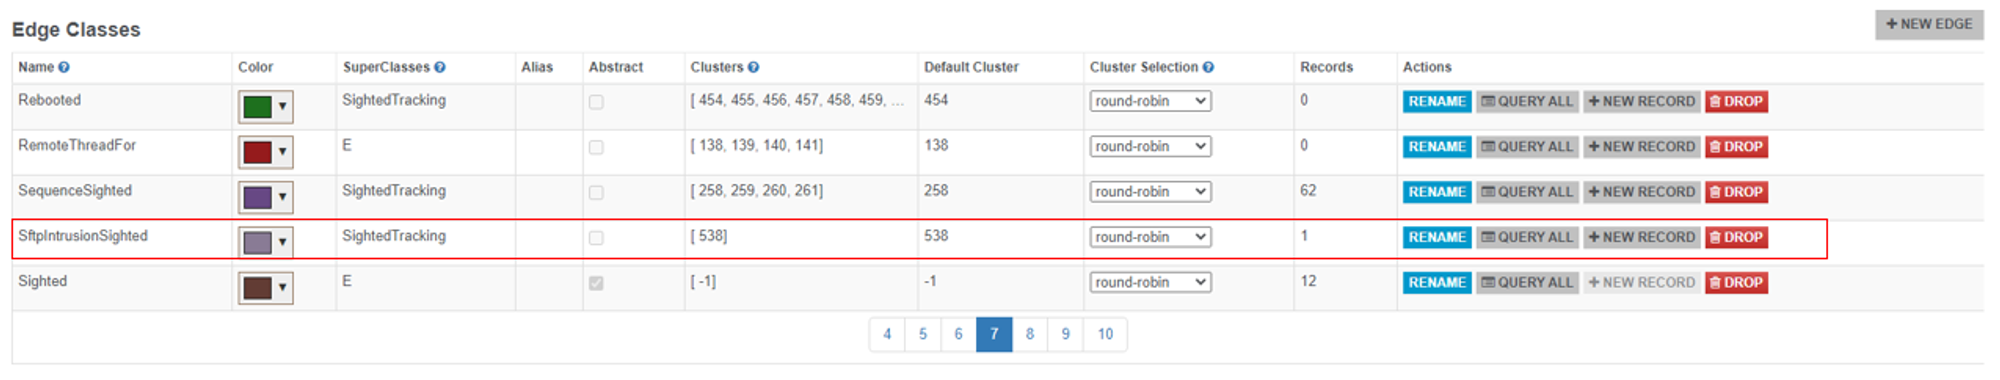
- Create a new edge class called SftpIntrusionSighted and assign it as a child class of SightedTracking edge-class. SftpIntrusionSighted needs to be a child class of SightedTracking because startDetection.js only processes children edges of SightedTracking edge-class.
Further improvement: Make this step automated
- Modify NetworkConnect function to create the SftpIntrusionSighted edge from ProcessCreate to NetworkConnect when 3 conditions are met:
- DestinationPort = 2222
- DestinationIP = IP of your backend server
- Image ≠ C:\Windows\openedr\Upload.exe
Added after Line 35 of NetworkConnect function:
// Added codes
// Check for the 3 conditions
if(r.field('DestinationPort') == 2222 && r.field('DestinationIp') == "192.168.1.7" && r.field('Image') != "C:\\Windows\\openedr\\Upload.exe") {
  // For debugging purposes
	print('Unauthorised access to SFTP event receiver service by ' + r.field('Image'))
  // Create SftpIntrusionSighted edge from ProcessCreate to NetworkConnect if all 3 conditions are met
	retry("db.command('CREATE EDGE SftpIntrusionSighted FROM " + pc[0].field('@rid') + " TO " + rid + "')")
}
Result:
- Modify startDetection.js to update a case whenever a SftpIntrusionSighted edge is created
- Create a SFTPIntrusionSighted case
case 'SftpIntrusionSighted':
	// Debug purposes
	console.log('Linking SFTP Intruson event...')
	// Update case + score
	updateCase(_stage3Score,event['Organisation'],event['Hostname'],event['@rid'], 'SFTP Intrusion', _severityLevel3)
	break;
After editing startDetection.js, get a shell into openedr-app container and reload the script.
Commands:
sudo docker exec -it openedr-app /bin/bash
pm2 reload detection
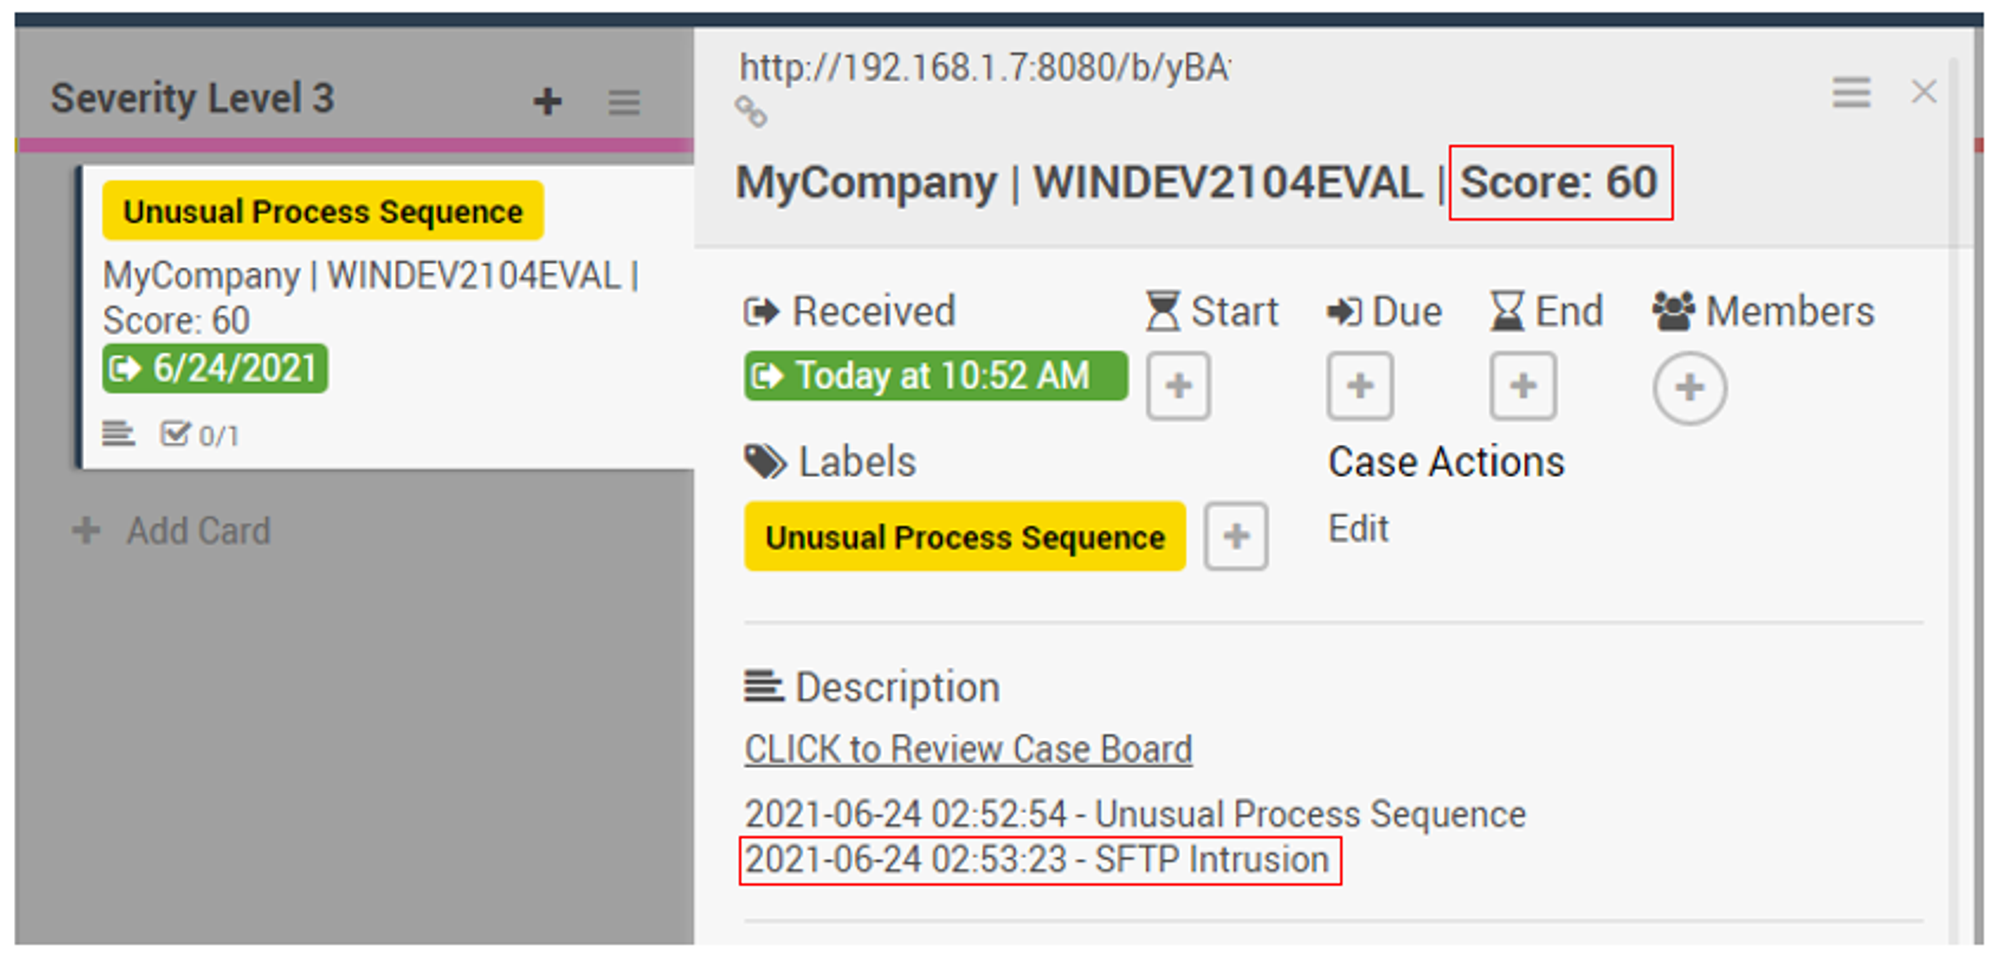
Initial issue was that the SFTP Intrusion label was not appearing on the Triage case board:
To fix the issue, I had to manually create the SFTP Intrusion label and reload the frontend.js script within openedr-app docker-container.
End results:
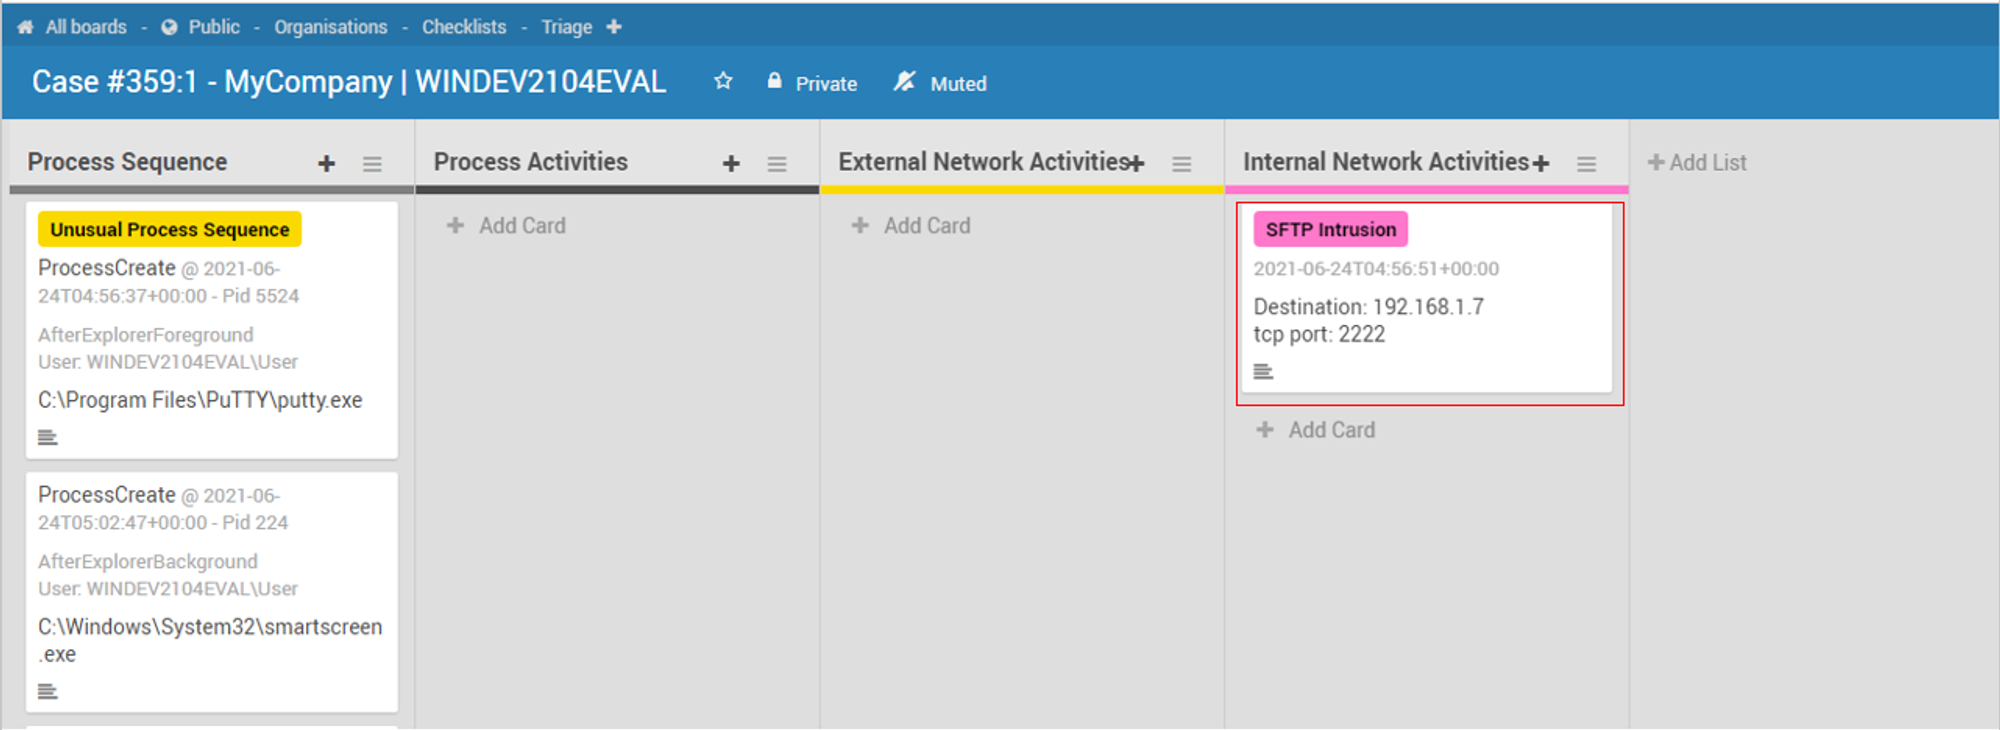
Triage board:
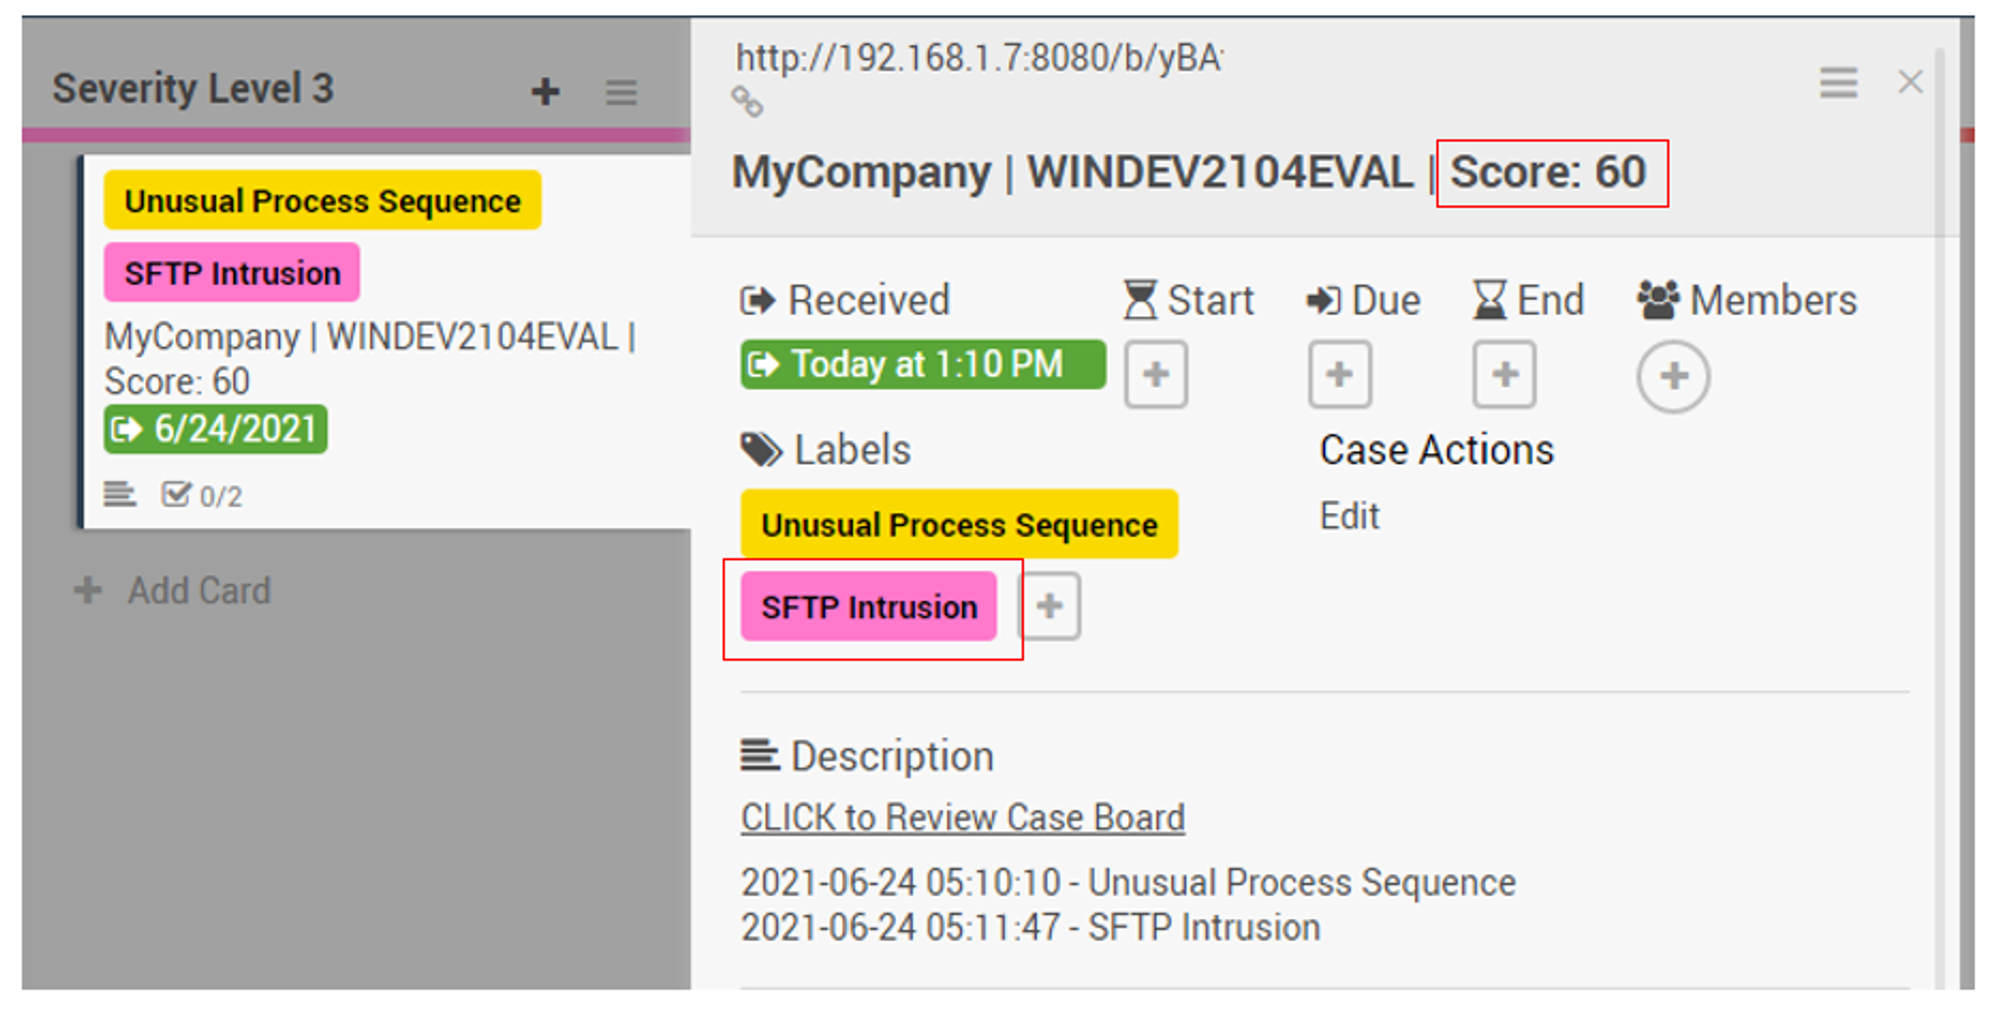
*Note that I assigned _stage3Score for SFTP Intrusion cases i.e. each SFTP intrusion case has a score of 40. Unusual Process Sequence (Score 20) + SFTP Intrusion (Score 40) = Total score of 60 as shown in the screenshot above.
Case board:
Outcomes
- Student gained concepts & procedures for endpoint testing for benign & offensive use-cases before working on these OpenEDR enhancement tasks
- Become proficient with a multi-modal NoSQL database (OrientDB) that have JSON document-store, graph & event Publish-Subscribe capabilities
- Understand the design of a SFTP container that has mechanisms that mitigate intrusion into central monitoring & reliable indicator of attack signals
- Experience event-driven development using OrientDB's Live-Query mechanism, which basically does away with traditional polling but use a event-subscription-query approach
- Appreciate Object-Oriented Parent-Child inheritance (SightedTracking is a Super or Parent edge-class of XXXXSighted child classes) in action to generalised alerting mechanism that just need 1 event-subscription to act on N alert-types, instead of creating N subscription queries
- Contribute to a open-source project that can used as a versatile teaching or training tool
Jym's Suggestions & Notes
Console.log printing vs Break-points with IDE
- Console printing may not be the best way
- Useful for ad-hoc debugging in situation when it is not possible to install an IDE for development
- Stepping-codes & setting break-points are crucial for asynchronous programming like nodeJS Javascript because things are not sequential like imperative programming (eg. Java, C#, Python..)
Which IDE & Where you are running it from?
- I will recommend Visual Studio Code since I am using it & can share tips quickly
- VSC has very good tutorials in both https://code.visualstudio.com/docs/editor/debugging & Youtube, whichever is your preference
- Other IDEs are equally useful but I can't help you directly, you have to Google more
- If you are hosting OpenEDR within Ubuntu Desktop, it is make sense to run VSC nearest to the containers, otherwise you have to change docker-compose to change port binding: https://github.com/jymcheong/OpenEDR/blob/master/docker-compose.yml#L24
- Bear in mind the backend script folder is mounted as volume within the openedr-app container: https://github.com/jymcheong/OpenEDR/blob/master/docker-compose.yml#L34
- The configuration .env file uses ORIENTDB_HOST=orientdb, this field is used within the container using docker's internal name resolution from within & between containers; we use name resolution because IP ranges across during docker platforms (eg. Windows vs MacOS vs Linux) can differ
- So when using IDE to step through startDetection.js with that ORIENTDB_HOST value, it will fail to connect since it can't resolve orientdb.
- If you modify that field, then you will need to remember to switch back for the container, thus I don't recommend this path
- It is easiest to just create an entry in your Ubuntu Desktop /etc/hosts
Event-Driven Testing can be Tedious
- You will realise by now, to create that graph showing putty.exe → NetworkConnect, you ran putty.exe on your Windows target
- That act of running putty to connect to SFTP service created an NetworkConnect event, of which gets ingested & causes your ODB function to do what it did; that's the event-driven testing part
- That test also proved your ODB function is functional so there's actually no need to repeatedly do that just to test your startDetection.js
- You can reduce the tedium by creating a simple ODB function that creates a SftpIntrusionSighted between an existing putty.ProcessCreate & putty.NetworkConnect & then just delete the edge if you are fussy with the graph showing too many edges between the 2 vertices.
- Another way is just to write a unit harness within the script such that it is called when it starts but you minimally need to ensure the connection from script to ODB is functional so that you create or update a Case record
PM2 manages scripts within OpenEDR-App container
- As you saw, the changes somehow are not reflected when you tried to test. That's because PM2 within container had already loaded a script instance
To set break-points & step-codes within your IDE, you need to stop the script within the container with PM2
Experience Github WorkFlow
- For starters, you may develop without Github
- When it is ready to commit, please fork OpenEDR & clone to your environment without overwriting your work!
- I suggest you use Github Desktop for productivity instead of meddling with git commands
- Two aspects to port to this local repo in your environment
- Assuming in the root director of OpenEDR, run ./backend/exportScripts/export.sh to export the schema & functions since you changed NetworkConnect function & added a new edge class
- Copy the modified startDetection.js to overwrite the local repo file
- Your Github Desktop will show the delta
- Write meaningful summary for the commit messages
- Commit changes then push to remote
- You can create a Pull-Request so that I can review the changes
- I will merge your changes into my dev branch after a review
Reviewing Example
thanks for the PR. So from my end, it looks something like this, I get notification, & as tech-lead, I will need to review.
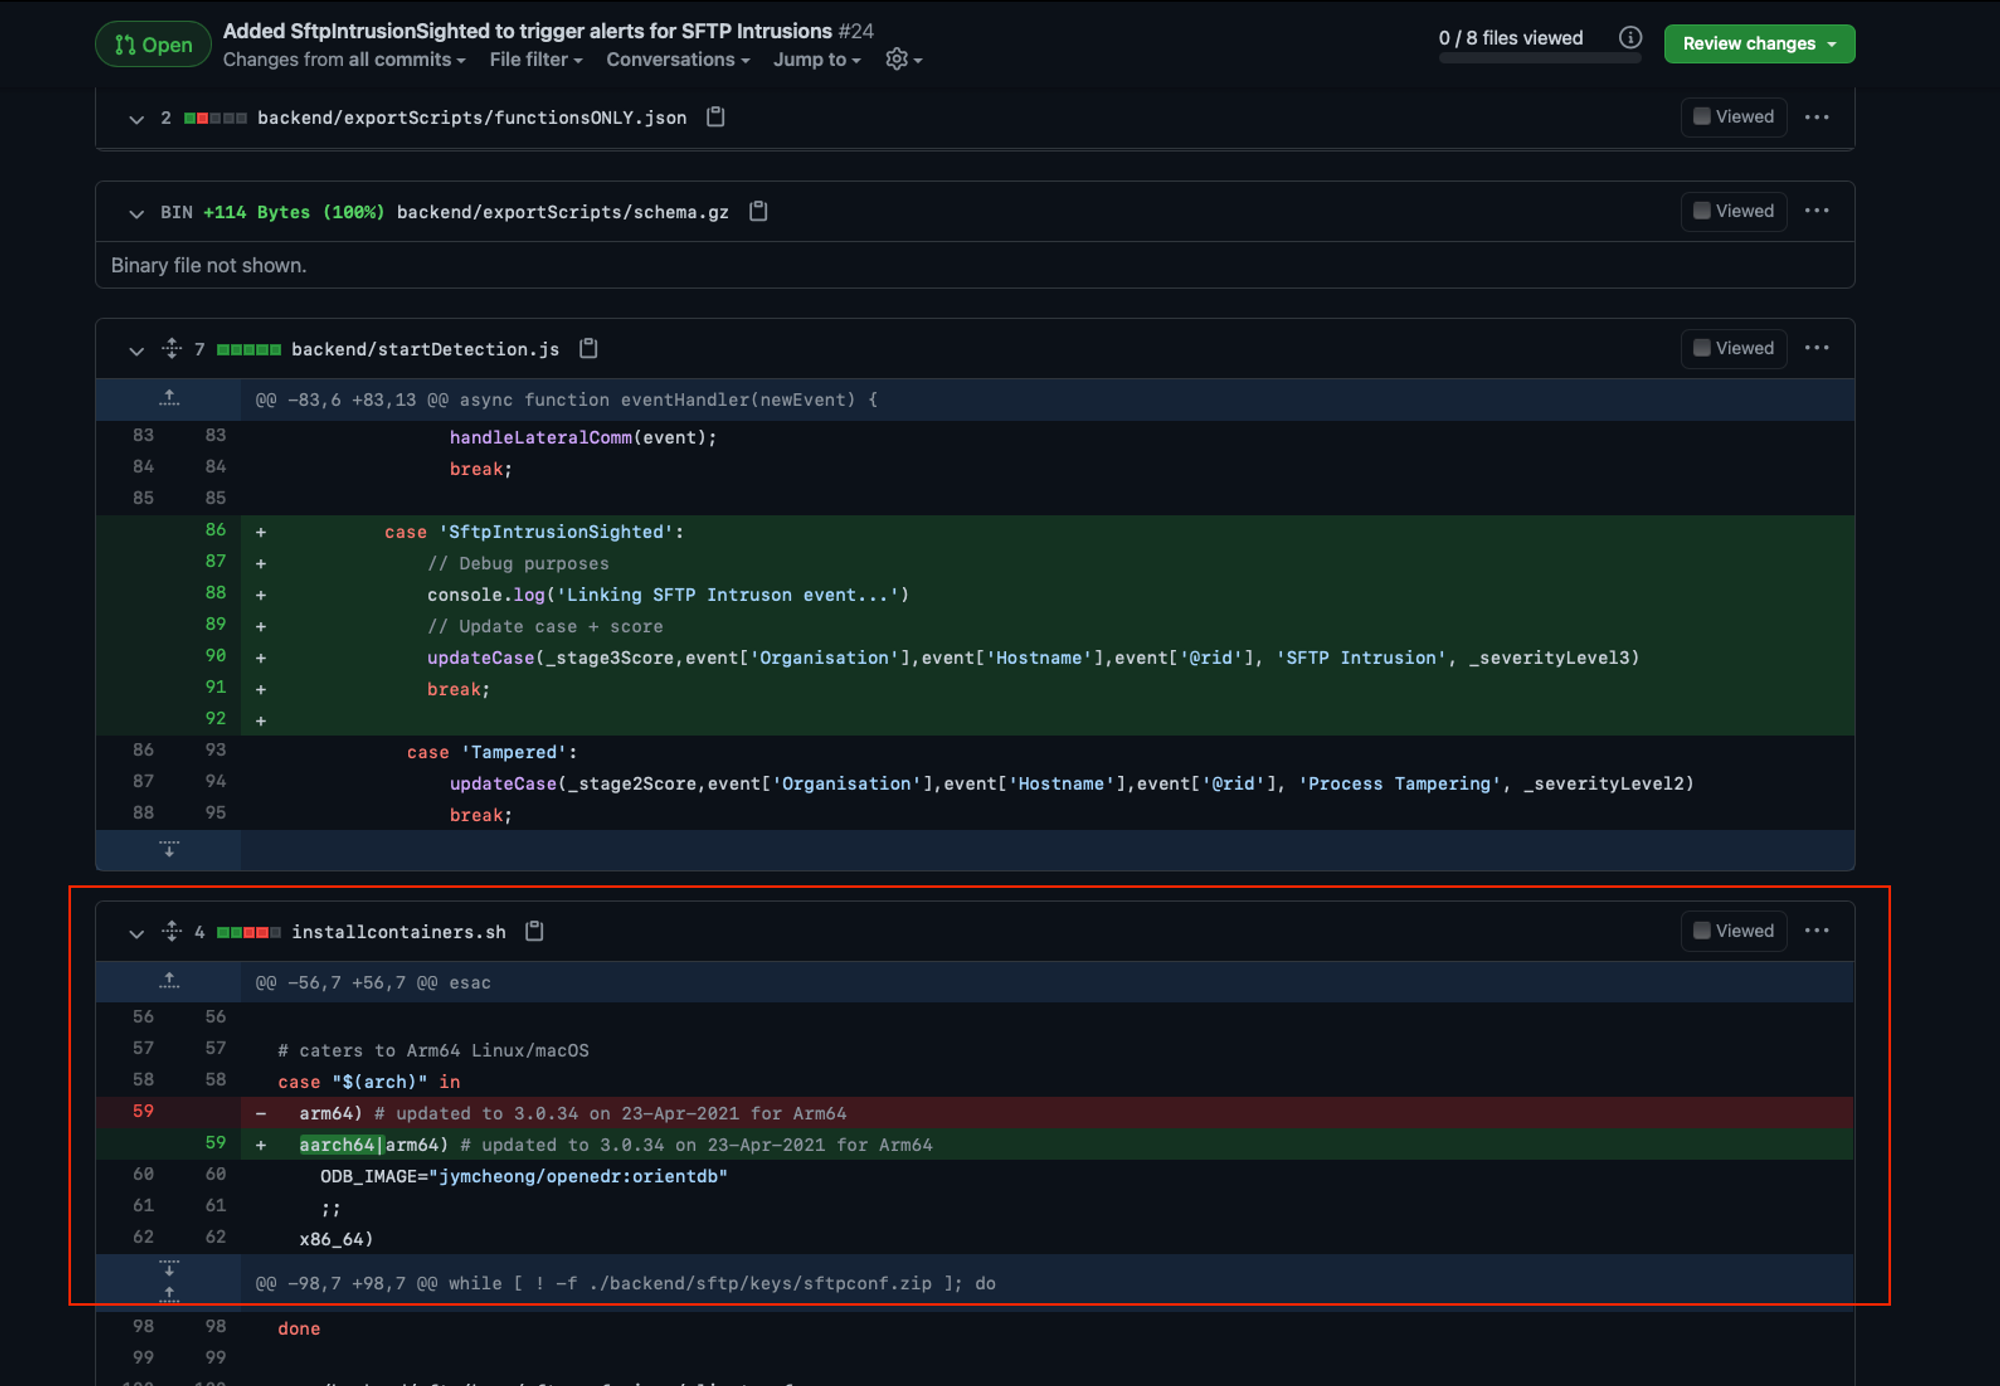
So I noticed somehow installcontainers.sh also get included in your PR, if I didn't check, I would overwrite my earlier changes.
I check through further before I do a merge.
Exporting Wekan Board Changes
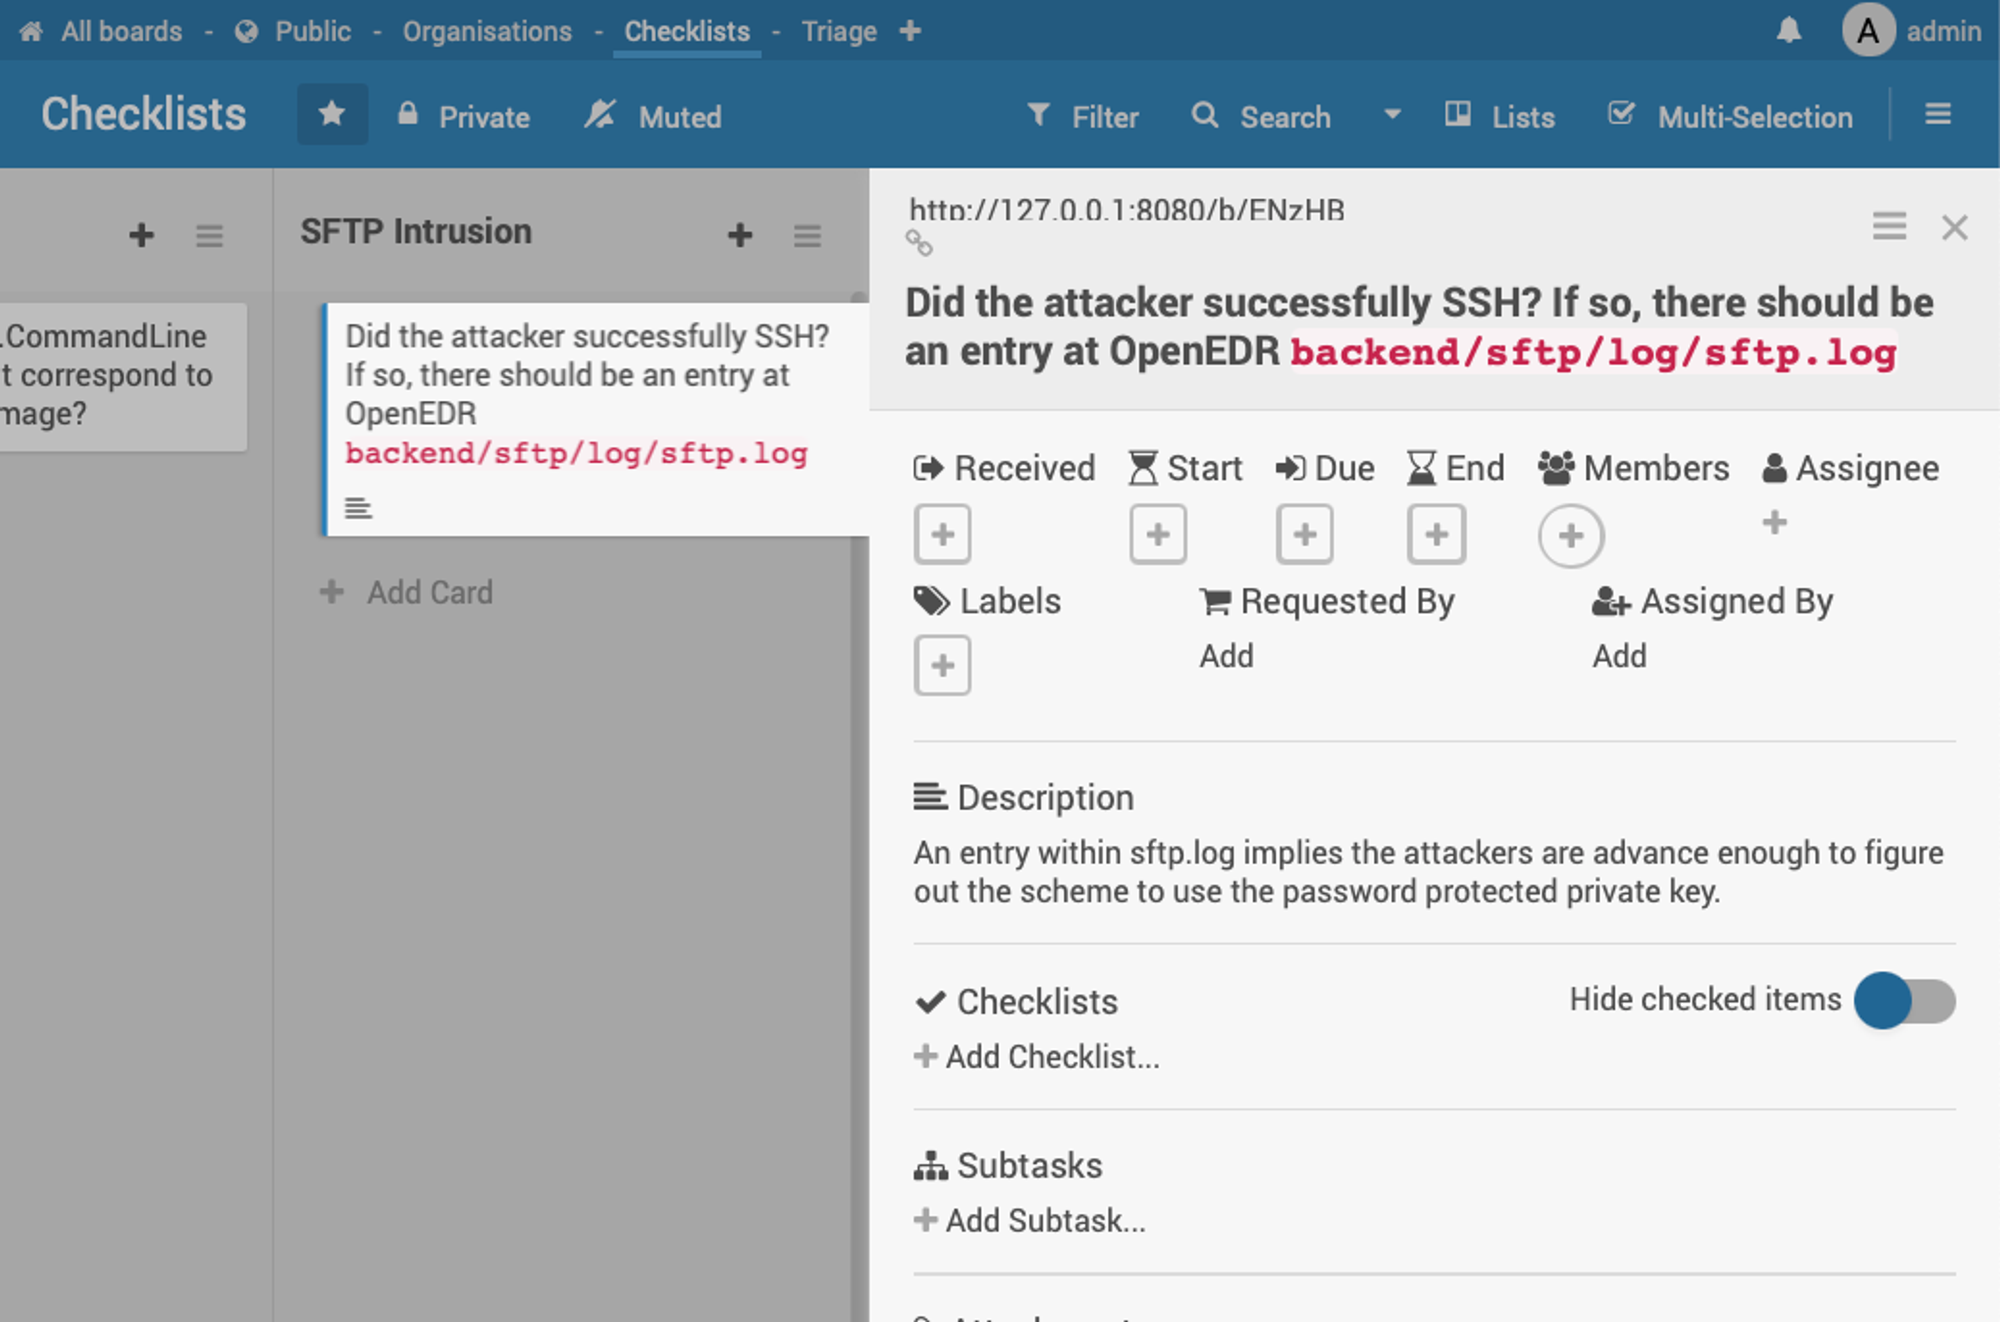
Besides the inclusion of the new label SFTP Intrusion, I also added a new checklist column along with a "guide" card.
DO NOT add changes to wekan frontend with lots of test data since export will also include test data.
Ensure the Wekan-db is wiped to "clean" state, add the changes, then export for Git commits.
Just to be clear, when I say successfully SSH, it means getting pass the authentication stage which is common for both SFTP & SSH for OpenSSH service. But when configured for only SFTP, SSHd will drop the session & log an event.
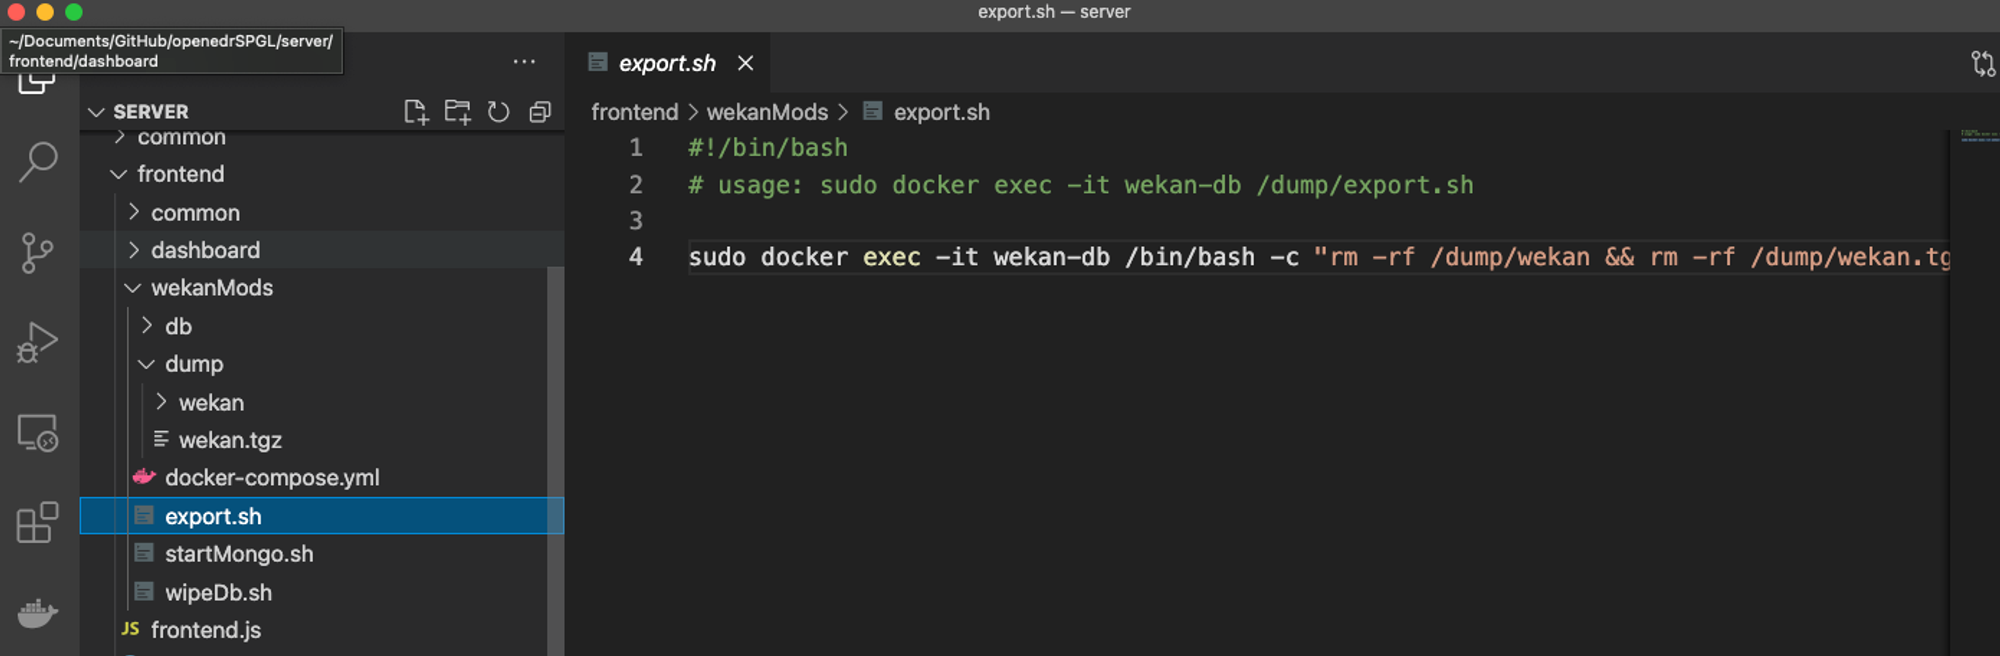
This script will create an updated wekan.tgz.
Simulating an attacker who figured out the key-phrase to use the id-key...