Overview of Datablocks
Datablocks is a node based editor with several blocks for processing and visualizing data. It's based on the open source library React Flow.
More information about Datablocks can be found here: https://webkid.io/blog/datablocks-node-based-editor-data-processing-visualization/
Official website: https://datablocks.pro/
Setting up Datablocks
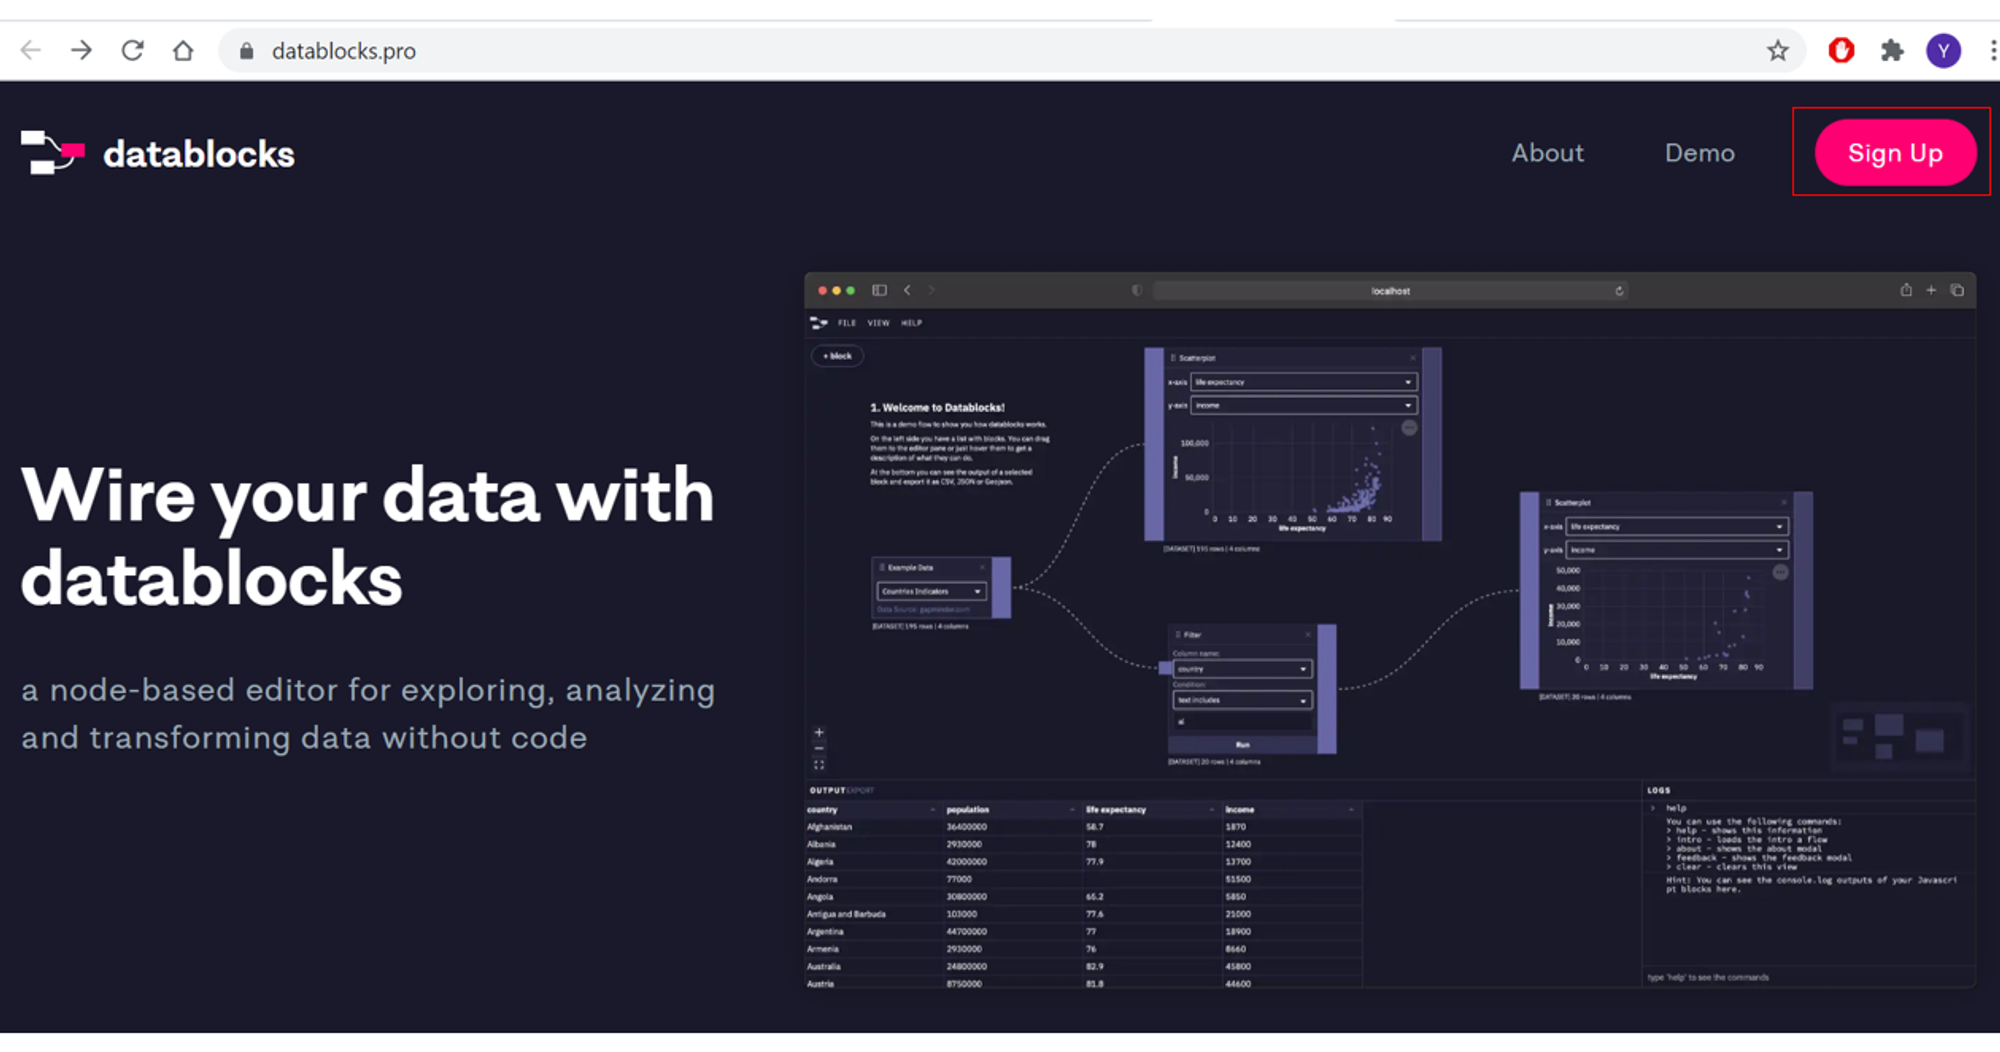
No installation is required for datablocks. All you need to do is to create a datablocks account by clicking on "Sign Up" as shown in the screenshot below. Once you have verified your email address, login to start using datablocks.
Datablocks Functionalities
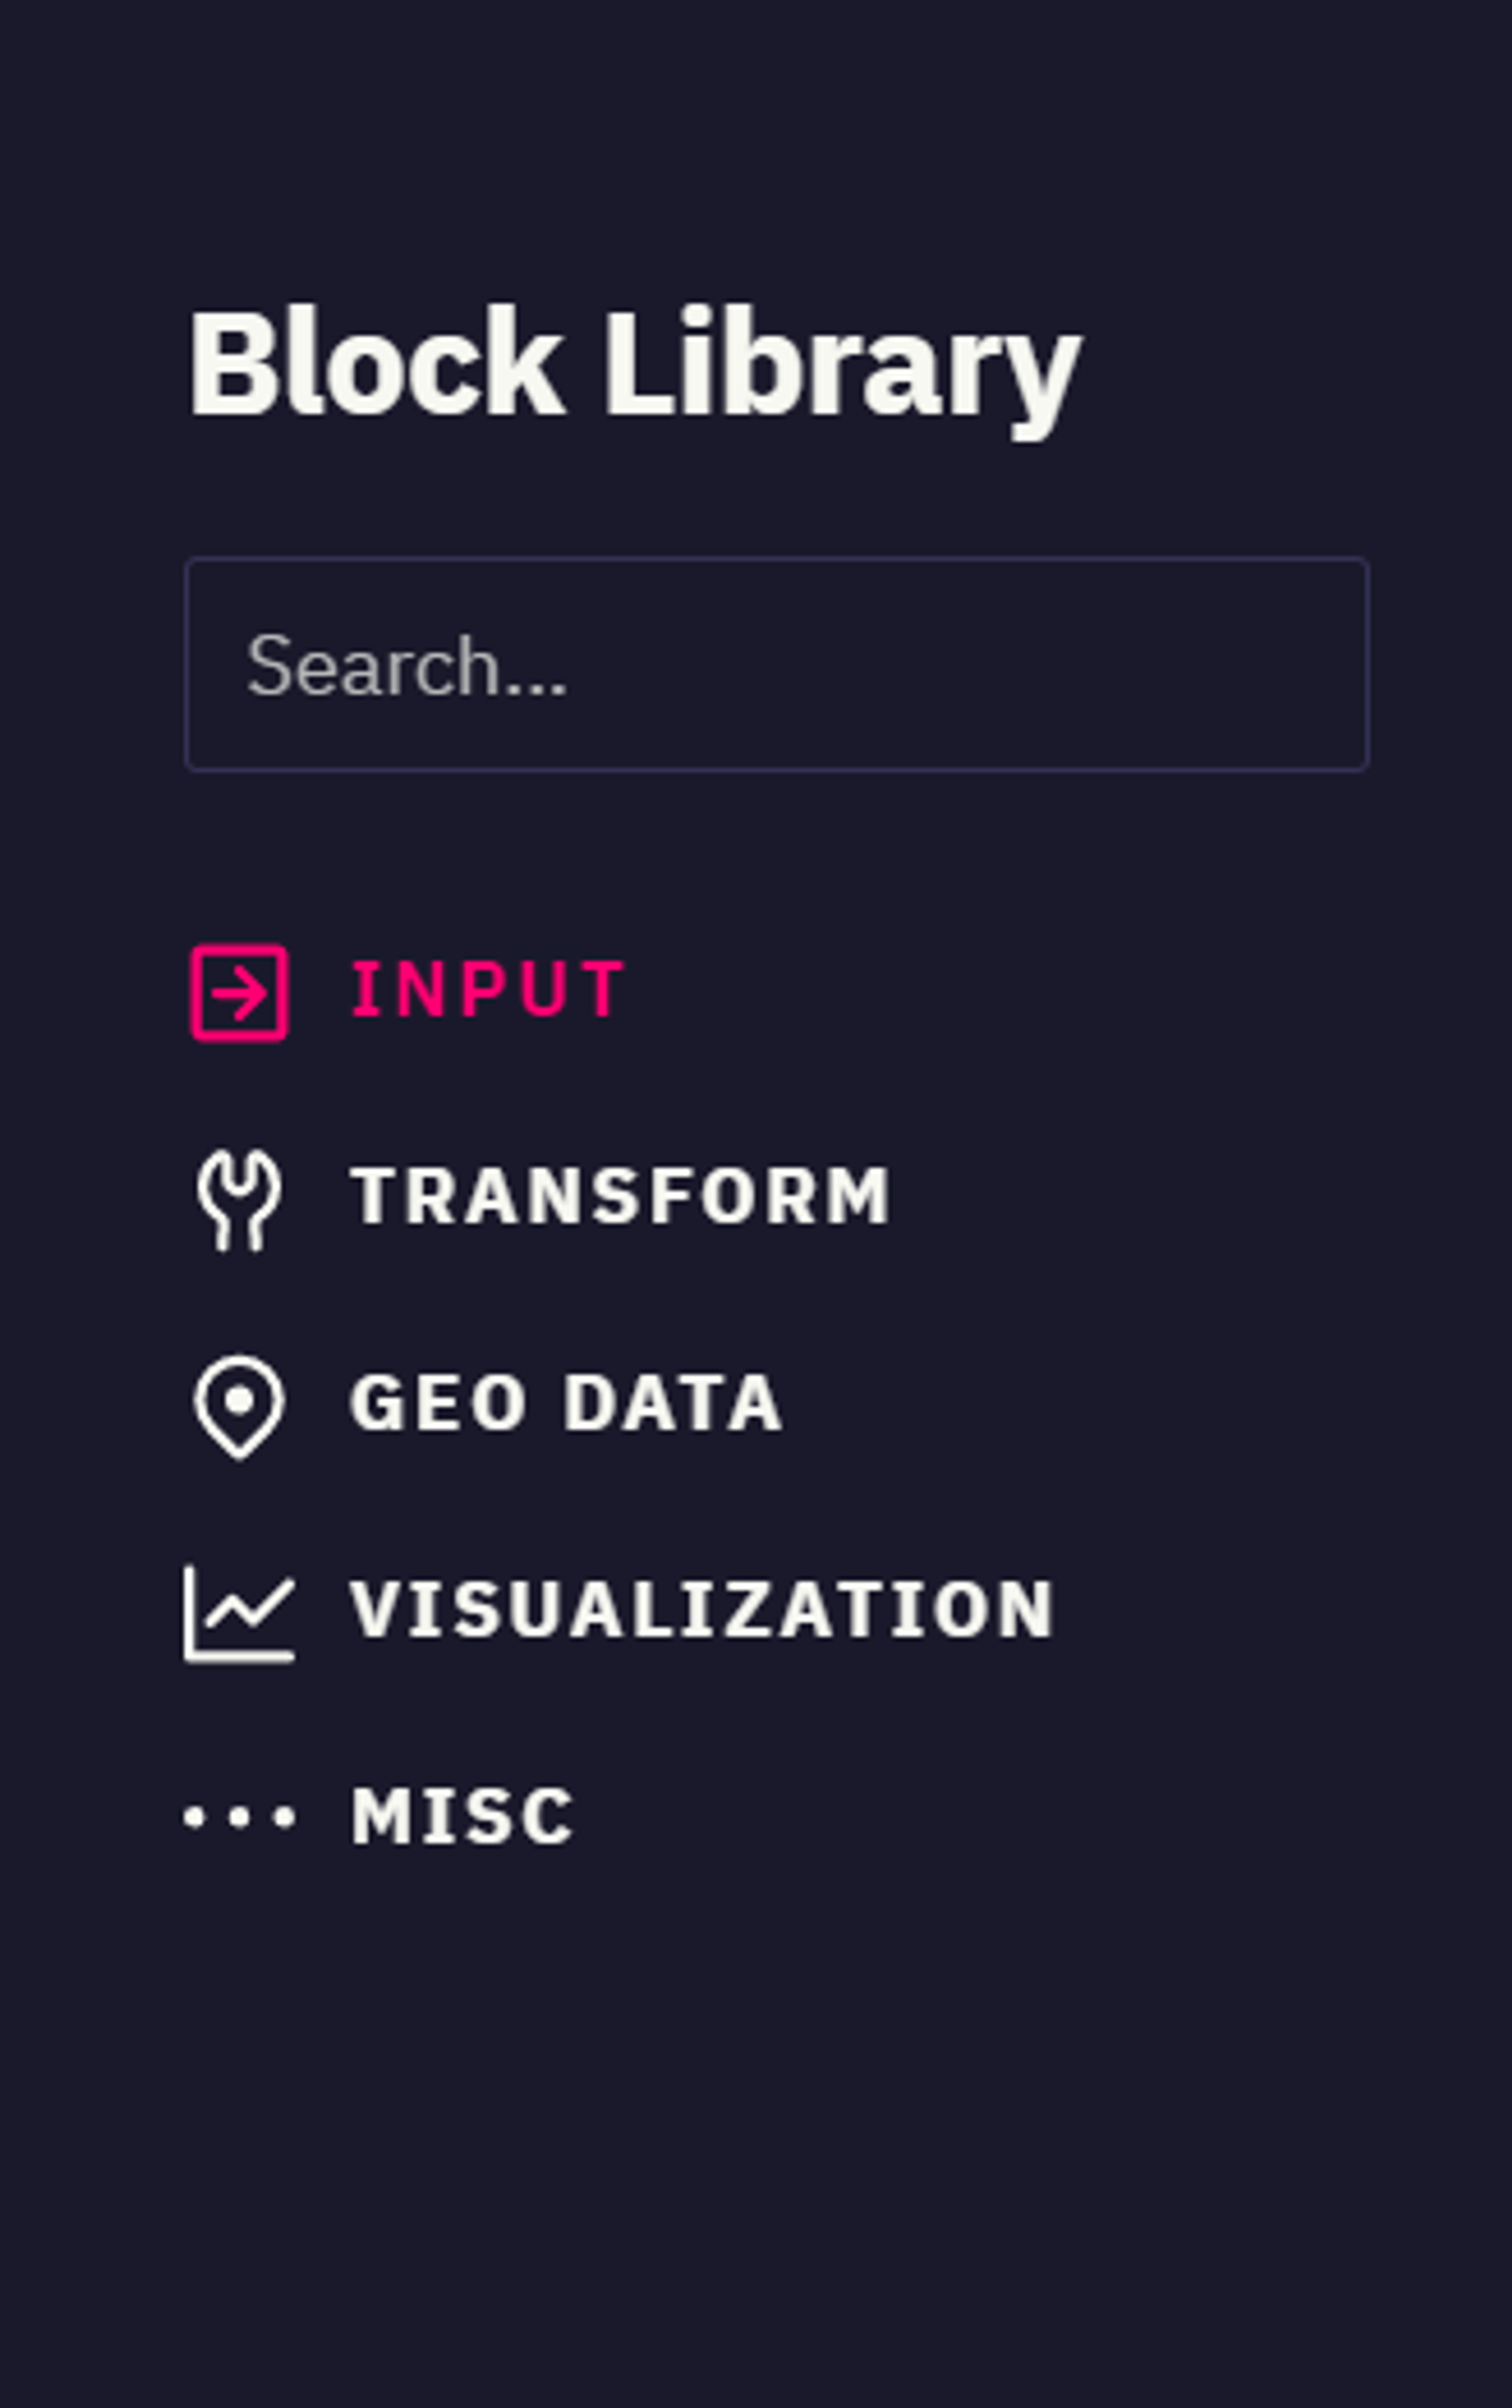
There are a total of 5 blocks in Datablocks:
The main purpose of Datablocks is to explore and visualize data that you input without any coding involved. Example of data visualization that I created in Datablocks using sample data:
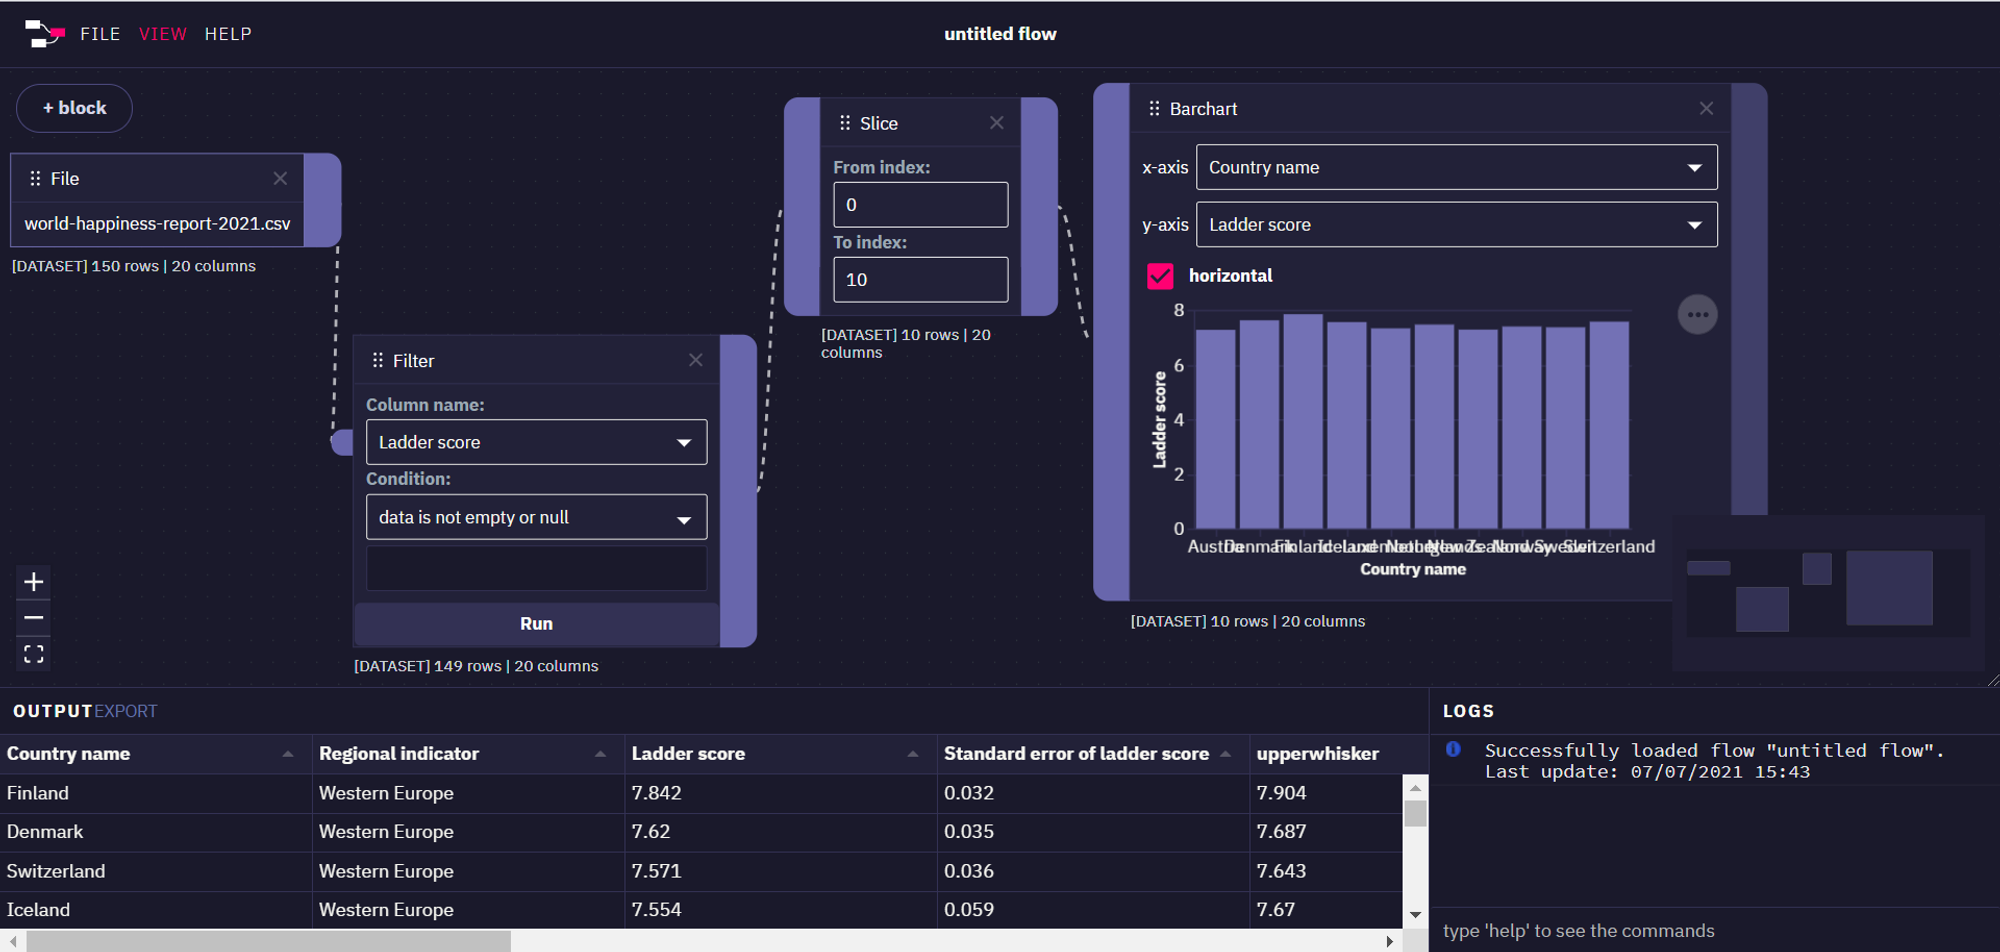
Flow of what I did: Input csv file → Filter out rows where ladder score is empty → Slice data to extract only the first 10 rows → Visualize data in barchart format
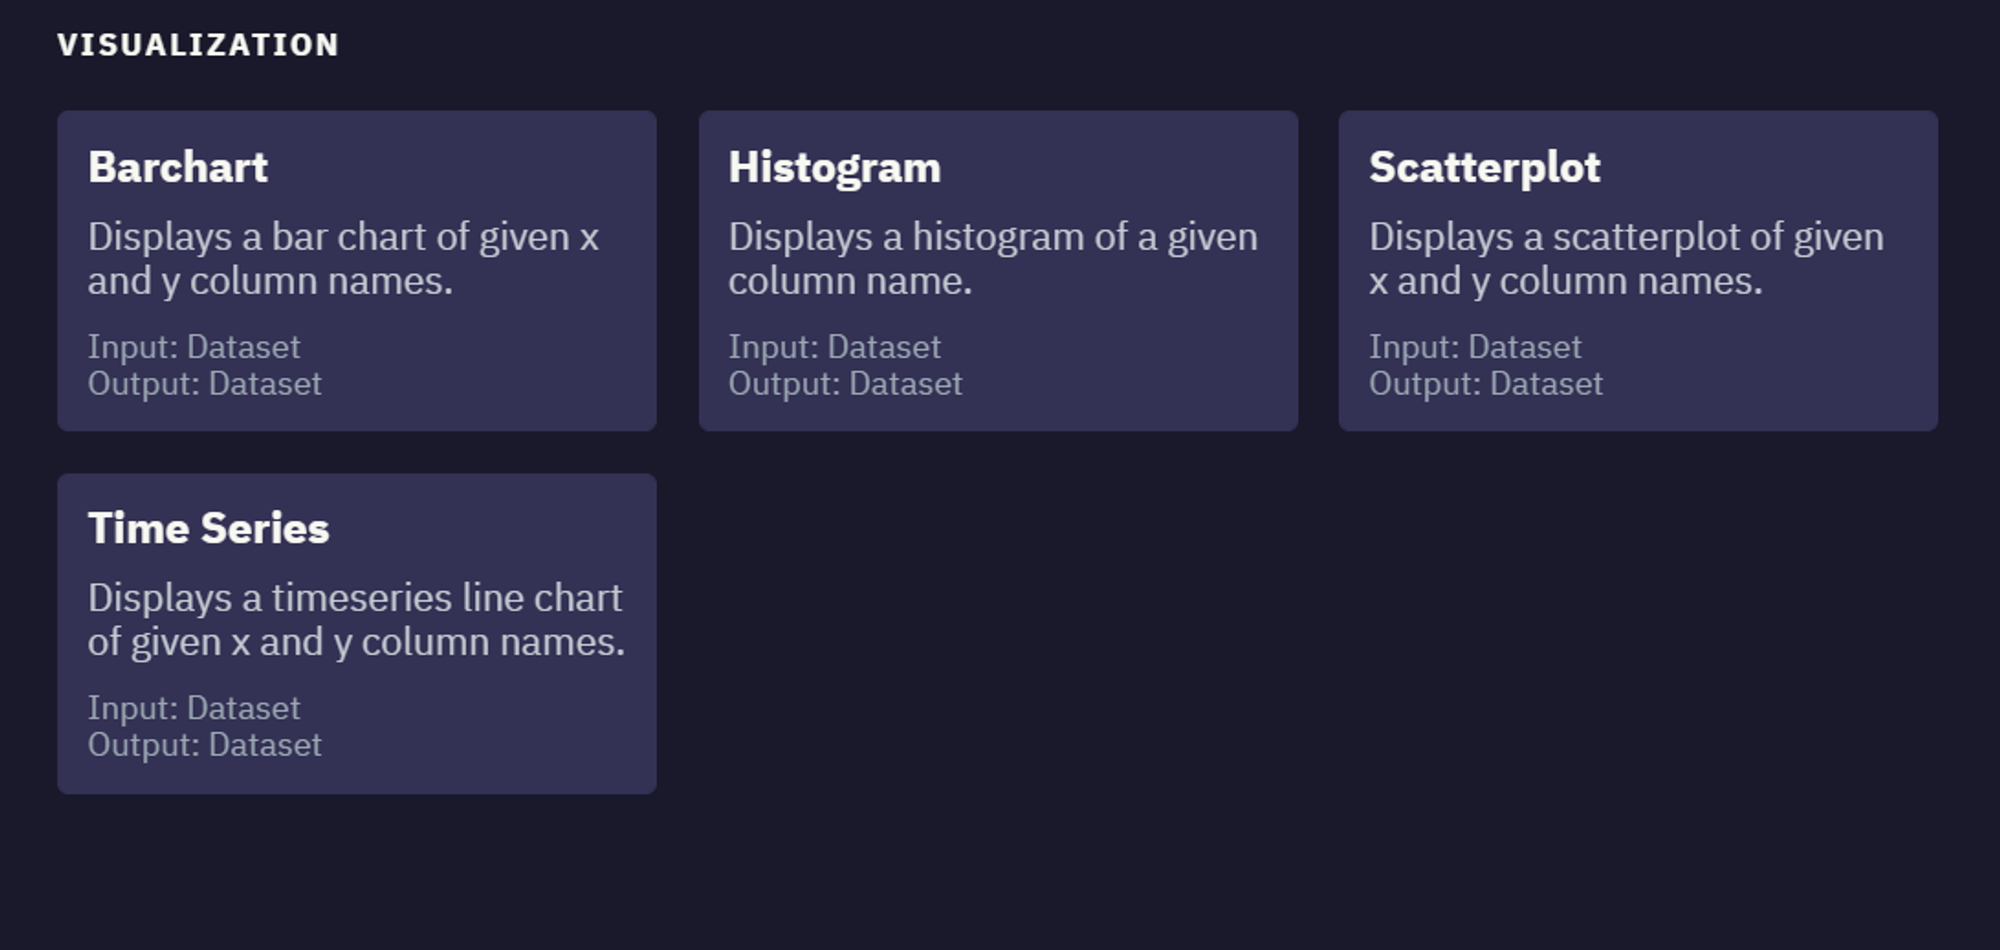
Total of 4 visualization formats to choose from:
Verdict
Rather than being a UI library/tool, Datablocks is more of a tool to process and visualize dataset. The processing/visualization options in Datablocks can be useful in areas like machine learning. Since Datablocks does not fit the needs of our frontend, I would not recommend Datablocks as the frontend library.